Measure a Nearby Supernova: Difference between revisions
No edit summary |
No edit summary |
||
| (10 intermediate revisions by the same user not shown) | |||
| Line 11: | Line 11: | ||
Here is how the SN2011fe appeared to a telescope at the University of Louisville's Moore Observatory 2 days after the discovery: | Here is how the SN2011fe appeared to a telescope at the University of Louisville's Moore Observatory 2 days after the discovery: | ||
[[File:m101_r_00028_20110826d_crop_median_annotated_v2.jpg|600px | <center> | ||
[[File:m101_r_00028_20110826d_crop_median_annotated_v2.jpg|600px]] | |||
SN2011fe in M101 on August 26, 2011 | SN2011fe in M101 on August 26, 2011 | ||
</center> | </center> | ||
| Line 27: | Line 27: | ||
We will use ImageJ to look at this file. To make it easier for you, we have cropped the original images and compressed them, while preserving the digital data. When you click the link below you will be connected to our server, ImageJ will load, and the image will appear in the usual window after a short delay. Although is image is cropped and compressed, it is still large and takes a noticeable time to download: | We will use ImageJ to look at this file. To make it easier for you, we have cropped the original images and compressed them, while preserving the digital data. When you click the link below you will be connected to our server, ImageJ will load, and the image will appear in the usual window after a short delay. Although is image is cropped and compressed, it is still large and takes a noticeable time to download: | ||
<center> | <center> | ||
[http:// | [http://www.astro.louisville.edu/js9_examples/js9_supernovae.html M101 in JS9] | ||
</center> | </center> | ||
The M101 image files for this experiment are available (see below) if you prefer to select them and display them locally. This is optional, but if you do use this you would be able to view the images with software running on your own computer. You will see a list of images. Select the one you want, right click, and "Save as ..." to download it. FITS files require ImageJ, Aladin, or ds9. Other file types may be viewed in various free or commercial programs, including ImageJ. The image we are using is one taken on September 2, 2011, and has a name with "20110902" in it. | The M101 image files for this experiment are available (see below) if you prefer to select them and display them locally. This is optional, but if you do use this you would be able to view the images with software running on your own computer. You will see a list of images. Select the one you want, right click, and "Save as ..." to download it. FITS files require ImageJ, Aladin, or ds9. Other file types may be viewed in various free or commercial programs, including ImageJ. The image we are using is one taken on September 2, 2011, and has a name with "20110902" in it. | ||
| Line 50: | Line 47: | ||
The measured signal from the star is related to the magnitude scale that we use to record the brightness of a star by this equation | The measured signal from the star is related to the magnitude scale that we use to record the brightness of a star by this equation | ||
<center> | <center> | ||
'''m = | '''m = m<sub>0</sub> - 2.5 log (s/s<sub>0</sub>)''' | ||
</center> | </center> | ||
Here "m" is the magnitude of a star we want to find, and | |||
Here "m" is the magnitude of a star we want to find, and m<sub>0</sub> is a magnitude we already know. The signal from the star we know is s0, and the signal from the star we do not know is s. To find m you take the ratio of s/s<sub>0</sub>, calculate the logarithm, multiply by 2.5, and subtract that from the known magnitude of the star. Here' the link to the web calculator again if you want to use it: | |||
<center> | <center> | ||
[http://web2.0calc.com/ Web 2.0 Calculator] | [http://web2.0calc.com/ Web 2.0 Calculator] | ||
</center> | </center> | ||
| Line 67: | Line 68: | ||
Recently a comprehensive paper by [http://arxiv.org/abs/1203.4013 Michael Richmond and Horace Smith] on the the supernova provided data for many nights, and we have plotted that data here together with measurements from Moore Observatory. | Recently a comprehensive paper by [http://arxiv.org/abs/1203.4013 Michael Richmond and Horace Smith] on the the supernova provided data for many nights, and we have plotted that data here together with measurements from Moore Observatory. | ||
<center> | |||
[[File:sn2011fe_photometry.jpg|600px]] | |||
M101 Photometry | M101 Photometry | ||
</center> | </center> | ||
| Line 102: | Line 102: | ||
<center> | <center> | ||
'''d = 10 (5+m-M)/5''' | '''d = 10 <sup>(5+m-M)/5</sup>''' | ||
</center> | </center> | ||
| Line 116: | Line 116: | ||
We will apply this idea to another galaxy that just had a supernova appear in March 2012. Here's what that looked like: | We will apply this idea to another galaxy that just had a supernova appear in March 2012. Here's what that looked like: | ||
<center> | |||
[[File:ngc4790_R_00011dfw_annotated.jpg|600px | [[File:ngc4790_R_00011dfw_annotated.jpg|600px]] | ||
Supernova SN2012au in NGC 4790 | Supernova SN2012au in NGC 4790 | ||
</center> | </center> | ||
| Line 134: | Line 134: | ||
Once again, we have | Once again, we have a version of JS9 set to provide this image to you: | ||
<center> | <center> | ||
[http:// | [http://www.astro.louisville.edu/js9_examples/js9_supernovae.html NGC 4709 in JS9] | ||
</center> | </center> | ||
| Line 155: | Line 155: | ||
<center> | <center> | ||
'''m = | '''m = m<sub>0</sub> - 2.5 log (s/s<sub>0</sub>)''' | ||
</center> | </center> | ||
| Line 165: | Line 165: | ||
There is just one more step to finding the distance the galaxy NGC 4790 from the apparent brightness of this supernova (apart from some questions of color and absorption by dust which we have ignored here). Since we observed it after maximum, you should subtract 1.5 magnitudes from the apparent magnitude you measured to get the magnitude m when it was brightest (remember that the brighter a star, the lower its magnitude. You know the absolute magnitude M too, from the measurement of M 101. Use | There is just one more step to finding the distance to the galaxy NGC 4790 from the apparent brightness of this supernova (apart from some questions of color and absorption by dust which we have ignored here). Since we observed it after maximum, you should subtract 1.5 magnitudes from the apparent magnitude you measured to get the magnitude m when it was brightest (remember that the brighter a star, the lower its magnitude. You know the absolute magnitude M too, from the measurement of M 101. Use | ||
<center> | <center> | ||
'''d = 10<sup>(5+m-M)/5</sup''' | '''d = 10<sup>(5+m-M)/5</sup>''' | ||
</center> | </center> | ||
| Line 175: | Line 175: | ||
''10. What is the distance to the galaxy NGC 4790?'' | ''10. What is the distance to the galaxy NGC 4790?'' | ||
Latest revision as of 02:46, 4 October 2015
SN2011au in Messier 101
The galaxy Messier 101 in Ursa Major is sometimes called the "Pinwheel" because it is spiral galaxy seen face on. It is relatively nearby, close enough to permit imaging its Cepheid variable stars and determining that its distance is 6.6 million parsecs (Mpc).
On August 24, 2011 a supernova of Type Ia appeared that was immediately captured in small telescopes well before it reached its maximum brightness. Subsequently the increase and eventual fading of the exploding star was recorded worldwide, and its behavior is the basis for a much improved understanding of the the processes that led to its demise. Supernova of type Ia are exploding white dwarf stars. They have the remarkably useful property of being extraordinarily luminous, and of reaching the same peak luminosity no matter the galaxy or the star of origin. Astronomers call objects like this "standard candles". Since their actual luminosity is know, their apparent luminosity tells us their distance.
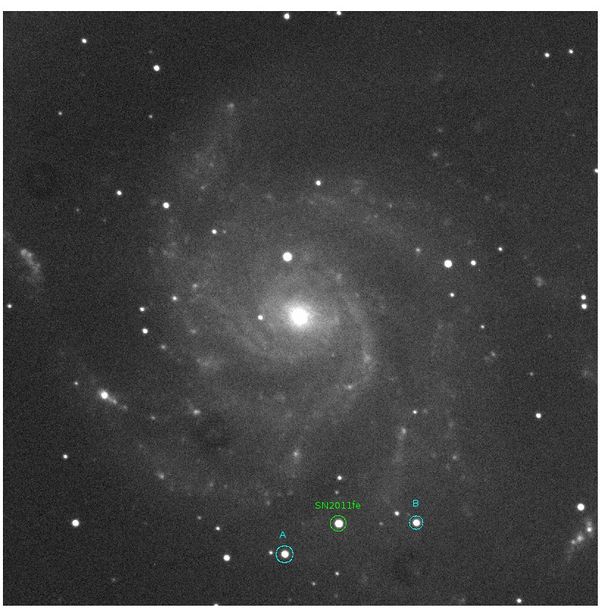
Here is how the SN2011fe appeared to a telescope at the University of Louisville's Moore Observatory 2 days after the discovery:
SN2011fe in M101 on August 26, 2011
This is an image in red light, taken through an "R" filter. The stars labeled A and B have been been measured to use as references to find the apparent magnidute of the supernova on this night. In red light they have magnitudes:
- A 13.290
- B 13.627
We will use ImageJ to look at this file. To make it easier for you, we have cropped the original images and compressed them, while preserving the digital data. When you click the link below you will be connected to our server, ImageJ will load, and the image will appear in the usual window after a short delay. Although is image is cropped and compressed, it is still large and takes a noticeable time to download:
The M101 image files for this experiment are available (see below) if you prefer to select them and display them locally. This is optional, but if you do use this you would be able to view the images with software running on your own computer. You will see a list of images. Select the one you want, right click, and "Save as ..." to download it. FITS files require ImageJ, Aladin, or ds9. Other file types may be viewed in various free or commercial programs, including ImageJ. The image we are using is one taken on September 2, 2011, and has a name with "20110902" in it.
In ImageJ, as you move the cursor over the image the control panel displays the location of the pixel and signal at that pixel. It may help for the following to zoom in on the stars. Use the "+" key and ImageJ will expand the view around the cursor. The "-" key takes you back out.
When the image first displays you will probably only notice a few bright stars. Use ImageJ's "image" menu, select "adjust", "brightness and contras", and set the maximum to something like 2000 units. With that you'll see a image that looks like the one one shown above for a previous night.
Examine the three stars - A, B, and the supernova. Find the brightest pixel in each one and write the signal down. Then, in the neighborhood near each star find a value representative of the background. This is not zero, so the signal you measure for a star is the sum of the star's signal and the background. We simply subtract the background from each measurement to roughly find the signal from the star.
Aside: For precision work an astronomer would use software that sums all the pixels in a star's image, and estimates the background all around the star. Just finding the peak and subtracting works well for learning how we do this.
1. What is the peak signal in star A on the image of SN2011fe in M101? (Hint: Put the cursor in A and move it around looking the maximum.)
2. What is the signal above background for the supernova itself in the image of SN2011fe? (Hint: After you find the maximum on the supernova, find the signal in the background and subtract it from the supernova signal.)
The measured signal from the star is related to the magnitude scale that we use to record the brightness of a star by this equation
m = m0 - 2.5 log (s/s0)
Here "m" is the magnitude of a star we want to find, and m0 is a magnitude we already know. The signal from the star we know is s0, and the signal from the star we do not know is s. To find m you take the ratio of s/s0, calculate the logarithm, multiply by 2.5, and subtract that from the known magnitude of the star. Here' the link to the web calculator again if you want to use it:
3. What is the apparent magnitude of SN2011fe on the date the image was taken?
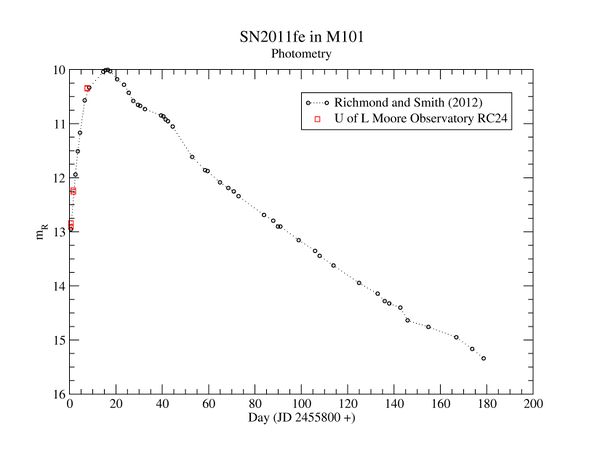
Recently a comprehensive paper by Michael Richmond and Horace Smith on the the supernova provided data for many nights, and we have plotted that data here together with measurements from Moore Observatory.
M101 Photometry
Astronomers use Julian days to keep count of elapsed time. Julian day number 2,400,000 was on November 16, 1858. The measurement you just made was on September 2, 2011, at JD 2,455,807.6 .
4. Compare your value to the light curve. How many days later than this image was the supernova at its brightest?
The absolute magnitude "M" of a star is the magnitude it would have if it were seen from 10 parsecs away. We're looking at the supernova in a galaxy that is known to be 6.6 Mpc away, so clearly it appears to be much fainter to us than it would be if nearby. The relationship between absolute magnitude M and the apparent magnitude at a distance d is
m - M = 5 (log d) - 5
This means that you take the logarithm of the distance, multiply it by 5, subtract 5 from the result, and that's the difference between apparent and absolute magnitudes. For example if d = 10 parsecs, log d is 1, and m - M = 0. That's just what you would expect because M is defined to be m at d = 10.
5. M101 is known from its Cepheid variable stars to be 6.6 million parsecs (6.6 Mpc) away. What is the "distance modulus", m - M, for this galaxy?
6. Use the maximum apparent magnitude (slightly brighter than your measurement), and find the absolute magnitude M for a supernova of this SN Ia type.
You have just calilbrated a supernova of Type Ia. Now, if you measure the magnitude of a supernova of this type at its maximum, you can find its distance by solving the relationship given above for d. It is given this way:
d = 10 (5+m-M)/5
If you are uncomfortable with algebra, this may seem daunting but it is really easy with the help of a calculator. Find the value of 5 + m - M, divide by 5, and raise 10 to that power. The web calculator has a function that does that for you. For a really simple example, if (5+m-M)/5 is 6, the d is 106, or 1,000,000.
SN2012au in NGC 4790
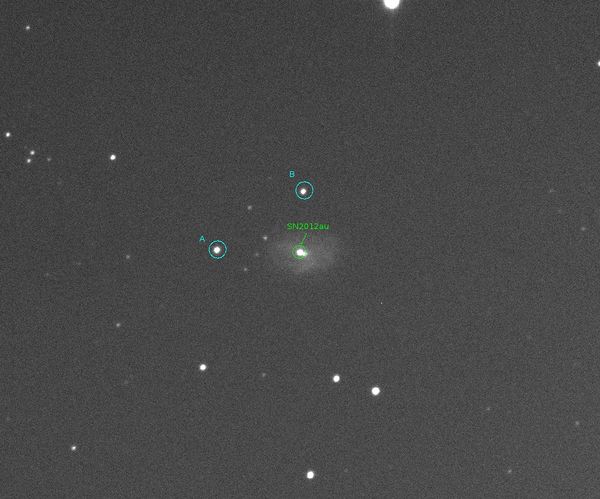
We will apply this idea to another galaxy that just had a supernova appear in March 2012. Here's what that looked like:
Supernova SN2012au in NGC 4790
This image was recorded in red light on April 12, 2012, JD 2,456,029.6 . The supernova was at its maximum in March, on JD 2456005.5, about 25 days earlier. You can see from the graph of the light curve for the supernova in M101 that in 25 days the supernova drops in brightness by about 1.5 magnitudes. Although we did not capture this one at its maximum, we can still estimate its maximum knowning how it decays and how long it has been since the maximum.
The reference stars in this image have magnitudes
- A 14.1
- B 14.2
Once again, we have a version of JS9 set to provide this image to you:
7. What is the signal above background for star A in the image of the galaxy NGC 4790?
8. What is the signal above background of the supernova in NGC4790?
You can use either star A or B, or both, to find the apparent magintude of the supernova.
m = m0 - 2.5 log (s/s0)
The two signals are s and s0, the magnitude m0 for star A is 14.1.
9. What is the apparent magnitude of the supernova in NGC 4790?
There is just one more step to finding the distance to the galaxy NGC 4790 from the apparent brightness of this supernova (apart from some questions of color and absorption by dust which we have ignored here). Since we observed it after maximum, you should subtract 1.5 magnitudes from the apparent magnitude you measured to get the magnitude m when it was brightest (remember that the brighter a star, the lower its magnitude. You know the absolute magnitude M too, from the measurement of M 101. Use
d = 10(5+m-M)/5
10. What is the distance to the galaxy NGC 4790?
Optional access to the original image files
Images for M 101 are available here:
Images for NGC 4790 are available here:


