Our Dynamic Sun: Difference between revisions
No edit summary |
|||
| (4 intermediate revisions by the same user not shown) | |||
| Line 5: | Line 5: | ||
Fortunately, there are images and data for the Sun available on line, even in "real time". You will be able to complete this experiment indoors at the computer with one simple exception - measuring the size of the Sun. For that part you will need a few minutes outside when there are no clouds blocking the Sun. We will start with that part now, but if it is night time or cloudy skip this and come back to it later. | Fortunately, there are images and data for the Sun available on line, even in "real time". You will be able to complete this experiment indoors at the computer with one simple exception - measuring the size of the Sun. For that part you will need a few minutes outside when there are no clouds blocking the Sun. We will start with that part now, but if it is night time or cloudy skip this and come back to it later. | ||
Projection | |||
== Projection == | |||
The safest way to observe the Sun, and one that allows everyone to see the image, is to project it on a screen. We can do this quite easily since the Sun is so bright there is more than enough light to make an enlarged image easily visible. It is the only astronomical object this technique works for. Even the Moon is too dim to view this way. | The safest way to observe the Sun, and one that allows everyone to see the image, is to project it on a screen. We can do this quite easily since the Sun is so bright there is more than enough light to make an enlarged image easily visible. It is the only astronomical object this technique works for. Even the Moon is too dim to view this way. | ||
| Line 66: | Line 67: | ||
Observing Sunspots with a Telescope | |||
== Observing Sunspots with a Telescope == | |||
Visit the Moore Observatory website's page on the Sun and solar flares: | Visit the Moore Observatory website's page on the Sun and solar flares: | ||
| Line 77: | Line 80: | ||
<center>[http:// | <center>[http://mlso.hao.ucar.edu/ Mauna Loa Solar Observatory in Hawaii ]</center> | ||
If you are in the astronomy laboratory on campus you | If you are in the astronomy laboratory on campus you also use the solar telescope in the lab, or walk over to the Planetarium and use the telescope in the garden if it is clear enough to see your shadow outside. These telescopes project an image of the Sun with enough detail to see many small spots on most days during the current solar cycle. | ||
''5. Are there spots on the Sun today? If so, count how many you see and describe them. In your response note the date and time for the data you are using, and their source.'' | ''5. Are there spots on the Sun today? If so, count how many you see and describe them. In your response note the date and time for the data you are using, and their source.'' | ||
| Line 85: | Line 88: | ||
Sunspots can change quickly, and even in a matter of a few hours new ones may appear. Large spots last long enough to be seen day after day. | Sunspots can change quickly, and even in a matter of a few hours new ones may appear. Large spots last long enough to be seen day after day. | ||
== Rotation of the Sun == | |||
If you were to go back to the same website tomorrow and look at a new image of the Sun, you might notice that not only have the spots changed their appearance, but they have apparently moved on the image. The Sun rotates on its axis and the spots are carried around in the same sense of direction that the Earth orbits around the Sun. Because the Sun rotates a complete turn in much less time than it takes the Earth to complete an orbit, the spots seem to us to drift from east to west across the face of the Sun. | If you were to go back to the same website tomorrow and look at a new image of the Sun, you might notice that not only have the spots changed their appearance, but they have apparently moved on the image. The Sun rotates on its axis and the spots are carried around in the same sense of direction that the Earth orbits around the Sun. Because the Sun rotates a complete turn in much less time than it takes the Earth to complete an orbit, the spots seem to us to drift from east to west across the face of the Sun. | ||
| Line 141: | Line 142: | ||
Sunspot Number | |||
== Sunspot Number == | |||
Finally, we would like to know how many spots there are. This is difficult to ascertain because everybody counts differently. Still, the coarse changes in spot numbers are apparent even with differences between observers. In 1848 the Swiss astronomer Johann Rudolph Wolf introduced a method which compensates somewhat for the effects of different telescopes and observing techniques to give a number that measures solar activity fairly well. | Finally, we would like to know how many spots there are. This is difficult to ascertain because everybody counts differently. Still, the coarse changes in spot numbers are apparent even with differences between observers. In 1848 the Swiss astronomer Johann Rudolph Wolf introduced a method which compensates somewhat for the effects of different telescopes and observing techniques to give a number that measures solar activity fairly well. | ||
| Line 158: | Line 161: | ||
[[File: | [[File:monthly_2014.png | 600 px | center ]] | ||
<center>Monthly Sunspot Number</center> | <center>Monthly Sunspot Number</center> | ||
| Line 172: | Line 175: | ||
''12. What is the approximate duration of a sunspot cycle?'' | ''12. What is the approximate duration of a sunspot cycle?'' | ||
In 2011 the Sun | In 2011 the Sun had just begun to recover from an unusually long sunspot minimum and the next cycle has begun. | ||
''13. When will the next maximum occur?'' | ''13. When will the next maximum occur?'' | ||
Latest revision as of 06:03, 28 January 2014
Before we begin, there's a necessary cautionary warning about the Sun:
It is true that it is not safe to look directly at the Sun without protecting your eyes properly. Except when the Sun is totally eclipsed, the energy of sunlight focused by the lens of your eye can permanently burn the retina. We are normally protected by our blink reflex, but in some cases someone may stare directly at the Sun with very damaging results. In a word -- don't!
Fortunately, there are images and data for the Sun available on line, even in "real time". You will be able to complete this experiment indoors at the computer with one simple exception - measuring the size of the Sun. For that part you will need a few minutes outside when there are no clouds blocking the Sun. We will start with that part now, but if it is night time or cloudy skip this and come back to it later.
Projection
The safest way to observe the Sun, and one that allows everyone to see the image, is to project it on a screen. We can do this quite easily since the Sun is so bright there is more than enough light to make an enlarged image easily visible. It is the only astronomical object this technique works for. Even the Moon is too dim to view this way.
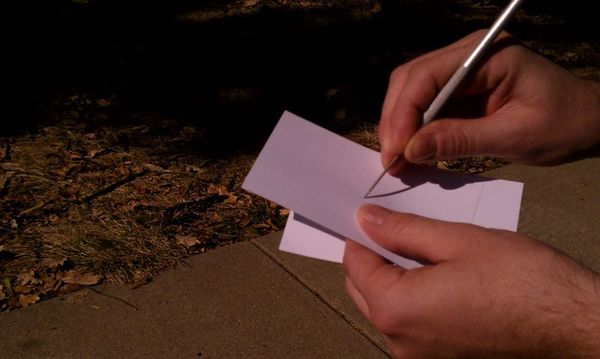
We'll just use a simple pinhole viewer at first. For this you need two stiff pieces of white paper or cardboard and a ruler. A 3x5 file card works fine, or printer paper is also good. Punch a small hole in the center of one of the pieces. (In metric terms, 1 mm is ideal. That's 1/25th of an inch. A hole as large as 1/16th inch will work.)


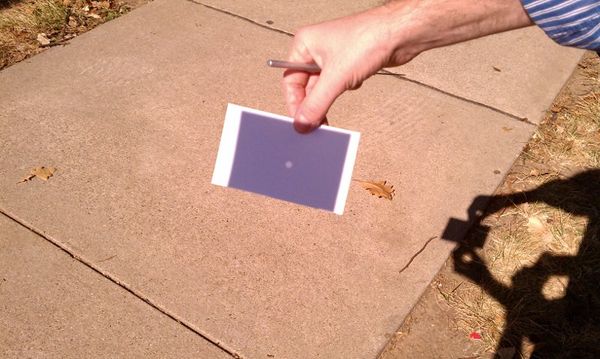
Now go on outside. Hold the sheet with the hole in it so that its shadow falls squarely on the other sheet. Separate the papers by an arm's length (roughly 1 meter or 40 inches) and you'll see a round spot of light on the lower sheet in the middle of the shadow of the upper one. That spot is actually a fuzzy image of the Sun.
1. Measure the diameter of the image (in mm). Just note that there are 25 millimeters (mm) in a inch. One centimeter (cm) is a little smaller than half an inch.
While you are at it, look at the image very carefully. You may notice that it has a spot or two on it. If there happen to be any really large sunspots they are sometimes visible with this pinhole projector.
2. Describe the image and note if you see any spots.
You have enough information now to calculate the angular size of the Sun seen from the Earth. If R is the distance you projected the image, S is the diameter of the Sun in the image, and π is about 3.14, then the angular size of the Sun in degrees is
The numerical factor converts from radians to degrees. S and R must be measured in the same units. For this measurement, R=1000 mm (1 m) and you just measured S.
Here's an example. Suppose that you measured the diameter of the Sun on the card to be 20 mm. (It isn't that large, but let's do the math to see how this works.) With that, A = 57.3 x 20 / 1000 = 1.1 degrees.
Use your own measurement of the diameter of the Sun's image on the card and do this calculation.
3. What do you find for the angular size of the Sun in degrees?
The Sun is about 150,000,000 km from Earth, and we see it as a small sphere in the sky that seems to be nearly the same size as the Moon. It's that great distance that makes it seem so small, when in fact it is nearly 100 times the size of the Earth.
You can calculate the size of the Sun by using this same formula to find S when you know A and R
when S and R and in the same units and A is in degrees. Take "A" from your answer to Question 3, and R as the distance to the Sun of 150,000,000 km.
4. What is the diameter S of the Sun in kilometers that would give it the angular size you measured?
Observing Sunspots with a Telescope
Visit the Moore Observatory website's page on the Sun and solar flares:
We will use this page as a resource for other websites, or you can use a search engine such as Google to find many resources on your own.
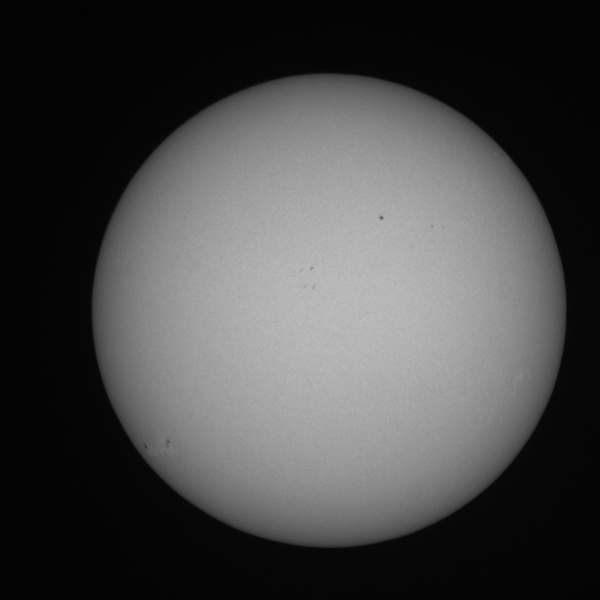
Scroll down the Observatory page to "Live Solar Images" and find one that shows the Sun in white light. Here's an example, but if it is cloudy at this site you may need to search for another where it is clear:
If you are in the astronomy laboratory on campus you also use the solar telescope in the lab, or walk over to the Planetarium and use the telescope in the garden if it is clear enough to see your shadow outside. These telescopes project an image of the Sun with enough detail to see many small spots on most days during the current solar cycle.
5. Are there spots on the Sun today? If so, count how many you see and describe them. In your response note the date and time for the data you are using, and their source.
Sunspots can change quickly, and even in a matter of a few hours new ones may appear. Large spots last long enough to be seen day after day.
Rotation of the Sun
If you were to go back to the same website tomorrow and look at a new image of the Sun, you might notice that not only have the spots changed their appearance, but they have apparently moved on the image. The Sun rotates on its axis and the spots are carried around in the same sense of direction that the Earth orbits around the Sun. Because the Sun rotates a complete turn in much less time than it takes the Earth to complete an orbit, the spots seem to us to drift from east to west across the face of the Sun.
Let's look for rotation in some very good images from Mees taken in 1998 when the Sun was very active. Here's one of them from August 3:
The others are on our server where you may look at them day-by-day.

In these images "North" in the sky is at the top, "West" on the right, "East on the left, and "South" at the bottom. Sky directions are based on the compas directions for an observer. That means "West" would be the right side of the Sun were we to see an image of it in a mid-day sky.
First look for a motion of major groups of spots across the Sun.
6. Identify the sense of rotation of the Sun in these images.
Pick a spot that crosses the center of the Sun in this sequence. With care not to scratch your computer display, use a ruler and orient it so that it is along the line that this spot moves day after day.
7. How far in centimeters does the spot move on each image each day? Average these values. We'll call that "X" in the directions below.
8. What is the diameter of the image of the Sun on your screen? We'll call that "D".
The circumference of the Sun on this scale is simply
whereπ =3.14 and D is the diameter of the Sun. It doesn't matter that "D" is measured on your computer display rather than the real Sun since all the measurements are scaled down by the same factor.
If a spot appears to move X each day on the average, it will take C/X days for it to move all the way around the Sun's circumference. This is just the apparent rotation period of the Sun:
<centerP = C/X = Pi D / X
Since you have measured D and X, you can now calculate how long it appears to us that the Sun takes to rotate on its axis.
9. What is the apparent period of rotation for the Sun in days?
There are a couple of problems with this technique. The image is foreshortened especially when spots are near the edge. That is why we asked you to pick spots near the center of the disk. Also, the Earth is going around the Sun, in the same sense that the Sun appears to rotate. This slows down the apparent rotation of the Sun, and its true rotation period compared to distant stars is about 2 days shorter than you measured.
You should also have noticed that the spots change from day to day. Look through the images in the database, and watch these daily changes.
10. What are the longest and shortest lived spots that you found in the collection of images on file?
Sunspot Number
Finally, we would like to know how many spots there are. This is difficult to ascertain because everybody counts differently. Still, the coarse changes in spot numbers are apparent even with differences between observers. In 1848 the Swiss astronomer Johann Rudolph Wolf introduced a method which compensates somewhat for the effects of different telescopes and observing techniques to give a number that measures solar activity fairly well.
Pick one of the images from the on-line collection from 1998, and a current recent image of the Sun. Count how many individual spots you can identify and call that number "S".
Also count the number of groups of spots, and call that "G". Multiply the number of groups by 10, and add the number of spots
to get the ``Wolf number, W.
11. How many sunspots were there in 1998 and today? How may groups of spots? What were the Wolf numbers then and now?
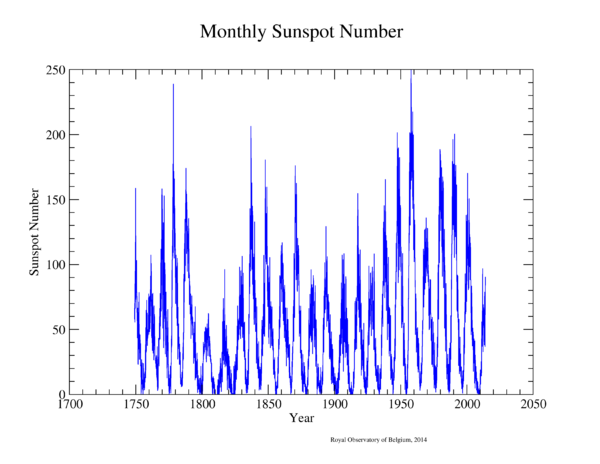
A daily record is maintained of the Wolf number by averaging measurements from many cooperating observatories. A graph of the monthly averages since the 1700's shows this remarkable pattern:

Compare your numbers with the graph. The largest daily count ever recorded came in December of 1957 at 355, but during periods of minimum activity you may see no spots at all.
There is clearly a pattern here. Count the number of cycles in sunspot number from 1750 to the present time, and divide the number of years (2010-1750) by the number of cycles.
12. What is the approximate duration of a sunspot cycle?
In 2011 the Sun had just begun to recover from an unusually long sunspot minimum and the next cycle has begun.
13. When will the next maximum occur?