Variable Stars in Messier 3: Difference between revisions
No edit summary |
No edit summary |
||
| Line 40: | Line 40: | ||
Some of the stars in these images have been precisely measured by comparing them to known stars in other fields of view. These become standards that we use to determine the properties of unkown stars. The standards in the field are identified in the map below by numbers and letters. The numbered stars are the ones we will use here since they were measured with modern electornic technology. | Some of the stars in these images have been precisely measured by comparing them to known stars in other fields of view. These become standards that we use to determine the properties of unkown stars. The standards in the field are identified in the map below by numbers and letters. The numbered stars are the ones we will use here since they were measured with modern electornic technology. | ||
<center> | |||
[[File:m3_sandage_standards.jpg|center|600px]] | [[File:m3_sandage_standards.jpg|center|600px]] | ||
Standard stars in M3 | Standard stars in M3 | ||
</center> | </center> | ||
| Line 105: | Line 106: | ||
You'll measure the signal from some of the standard stars on the map above. We have selected a region of the image of M3 taken in a 300 second exposure through the "V" filter. You will need to measure the images quantitatively, and we have ImageJ set up to make this easy for you. Use the following link to start ImageJ with two images of M3. One of the images is the center of the cluster, and the other is the north west (upper right) part of the map. | You'll measure the signal from some of the standard stars on the map above. We have selected a region of the image of M3 taken in a 300 second exposure through the "V" filter. You will need to measure the images quantitatively, and we have ImageJ set up to make this easy for you. Use the following link to start ImageJ with two images of M3. One of the images is the center of the cluster, and the other is the north west (upper right) part of the map. | ||
<center> | |||
Click Here >> [http://www.astro.louisville.edu/js9_examples/js9_m3.html Start JS9 with images of M3] | Click Here >> [http://www.astro.louisville.edu/js9_examples/js9_m3.html Start JS9 with images of M3] | ||
</center> | |||
Or, if you already have astronomical display software such as "DS9", "ImageJ", or "Aladin" on your computer, you may download the images and run them locally if you prefer. We recommend trying JS9 first since will be easiest for you to use. | Or, if you already have astronomical display software such as "DS9", "ImageJ", or "Aladin" on your computer, you may download the images and run them locally if you prefer. We recommend trying JS9 first since will be easiest for you to use. | ||
<center> | |||
Click Here >> [http://prancer.physics.louisville.edu/classes/108/topics/imagej_m3/images Download images of M3 to run locally] | Click Here >> [http://prancer.physics.louisville.edu/classes/108/topics/imagej_m3/images Download images of M3 to run locally] | ||
</center> | |||
Remember to right click and "Save file as" if you want to save an image for local use. Fits images work with Imagej, Aladin, and ds9. The tif images work with Imagej, and photographic image programs like Photoshop and Gimp. | Remember to right click and "Save file as" if you want to save an image for local use. Fits images work with Imagej, Aladin, and ds9. The tif images work with Imagej, and photographic image programs like Photoshop and Gimp. | ||
Latest revision as of 02:21, 3 October 2015
Spherical clusters of old stars that are known to astronomers as "globular" star clusters surround many galaxies, including our Milky Way. The brightest are barely visible to the unaided eye -- Omega Centauri in the southern hemisphere sky is so bright it is given a name indicating it appears like a star in Centaurus. There are over 100 of them known in the Milky Way, and in the northern sky most were cataloged by Charles Messier. Objects in his catalog of "things not to mistake for comets" include M3, oneof the largest and brightest globular clusters visible in the northern hemsiphere.
Because all of the stars in a globular cluster were formed at the time the galaxy was formed, the stars in them are all of the same age. The massive stars from the initial population have evolved so much that they are no longer on the main sequence, and of those the most massive are no longer visible having long since used all their fuel. Others are consuming helium or heavier elements left over from hydrogen burning and are seen as red giant stars. The least massive, some like the Sun or smaller, may still be on the main sequence, but they are faint and do not stand out from the crowd. The wide variety of star brightnesses and colors is apparent in the color image below:
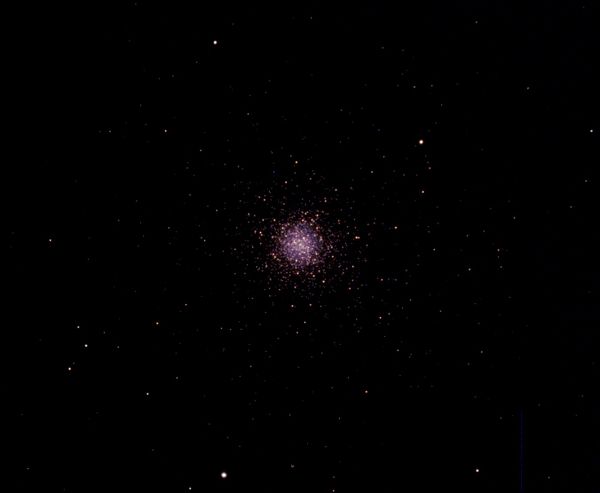
M3 in a composite of 3 images in red (R), green (V), and blue (B) light, each a 5-minute exposure with the 20-inch telescope at Moore Observatory taken on April 2, 2012.
The image covers a field approximately the size of the full Moon.
In this image the total number of photons recorded at each point has been converted to a brightness on the screen so that the colors approximate what your eye would see. The scale is compressed logarithmically and the brightest stars on the screen are approximately 100x brighter than the faintest ones. There are other ways of rendering data to images, and the colors may be adjusted to show subtle differences in star color. You can tell from the picture that there are thousands of stars toward the center, and a closer view adjusted to enhance the color differences is shown below.
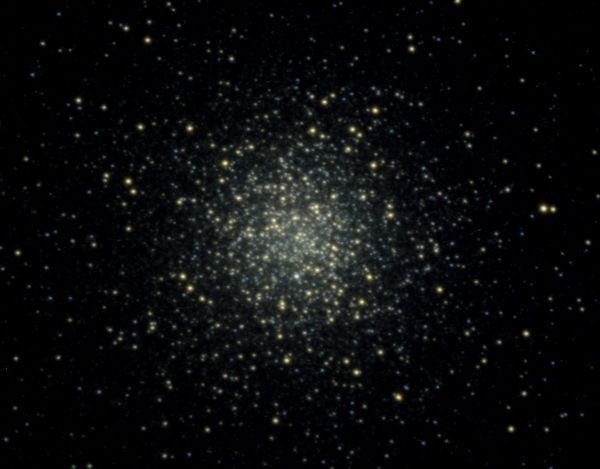
A color enhanced composite of 100 second exposures through R, V, and B filters with the 20-inch telescope at Moore Observatory taken on March 13, 2012.
This is a logarithmically scaled image adjusted to show subtle color differences betwen the brightest and fainted stars.
The brightest stars in the images are redder than the fainter stars because they are cooler. They are brighter because they are also larger in diameter, and consequently they are called "red giant" stars. Although all the stars in this cluster have the same age, the more massive stars have aged more rapidly and are no longer on the Main Sequence using hydrogen as fuel to make the energy that they radiate. Red giants are consuming the helium that was produced when the star was a "normal" main sequence star, and they are in a state of rapid change as their interiors adjust to the new coniditions.
The brightest red giants in this image would be visible by eye if you were to look at this cluster with an 8-inch backyard telescope. They are 12th magnitude or even brighter. The fainter blue stars in the image are 15th magnitude or fainter, and are difficult to perceive visually except in very large telescopes. The CCD detector that recorded this image provides a quantitative measurement of exactly how many photons arrived from the star while the shutter was open. By comparing the numbers at different places in the images, we can infer how much more light one star is emitting than another. We can even measure the color of a star by making these measurements through filters that isolate limited parts of the spectrum. Through measurements such as these we can tell when stars vary in brightness and color, and detect stars that are unstable.
Perhaps surprisingly, as stars age some of them go through a stage during which they pulsate in size periodically. When this happens their temperature changes along with their size, and they change color and luminosity. There is a class of stars known as RR Lyrae variables (a typical one is found in the constellation of Lyra) that are common in globular star clusters because they occur for stars at an age i typical of the stars we see in these images. All of the stars that pulsate in this way are very similar physically, and while they vary in brightness with periods of hours to days, their average luminosity is always nearly the same.
Some of the stars in these images have been precisely measured by comparing them to known stars in other fields of view. These become standards that we use to determine the properties of unkown stars. The standards in the field are identified in the map below by numbers and letters. The numbered stars are the ones we will use here since they were measured with modern electornic technology.
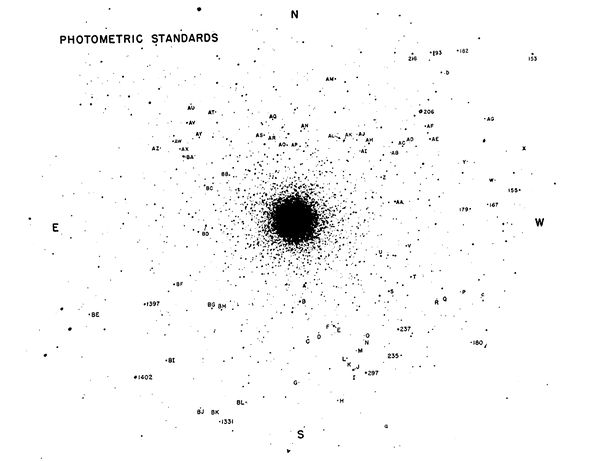
Standard stars in M3
The numbered standard stars are of known apparent magnitude mV, the magnitude seen through a "visible light" (V) filter. This green filter closely approximates the sensitivity of the dark adapted eye:
- # mV
- 206 9.86
- 1402 12.67
- 1397 12.70
- 297 12.86
- 237 14.07
- 216 14.15
- 153 14.24
- 179 14.71
- 155 14.60
- 193 14.74
- 235 15.72
- 182 15.73
- 167 15.17
- 1331 15.27
- 180 15.19
- a 16.77
- b 17.90
- c 19.12
The larger the magnitude, the fainter the star. You can see on the map that the stars with tiny dots are fainter than 15, while the brightest star is magnitude 10. A difference of 5 on the magnitude scale is a factor of 100x in light detected. We write this mathematically in this way:
S1 / S2 = 102/5 (m2 - m1)
To see how this works, try the example of 10th and 15th magnitude. The difference is 15-10=5, and 2/5(5)=2. The right hand side is 102, or 100 times. If the brighter star has a signal of 100,000, the fainter one would have a signal of 100,000/100=1000.
How do we turn this around the other way, so that if we know the signal we can find the magnitude? That's what logarithms do, a function that provides the power or exponent. The logarithm of 10 is 1, of 100 is 2, and of 1000 is 3. For other numbers, you can use a calculator:
When you click the link a calculator should appear in a browser window, or use one of your own. Enter a number, press "log", and it will give you the power of 10 that will make that number. You can see from the definition of magnitude that this is simply
m2 - m1 = 5/2 log (S1 / S2)
For example, subsitute S1 = 50000 and S2 = 500 in this, and you'll have 5/2 log (100) on the right. That's just 5. If star 1 is 100 times brighter than star 2, then star 1 is 5 magnitudes "brighter" than star 2. The trick is that brighter in magnitudes means a smaller number.
1. What is the difference in magnitudes if one star is 2.512 times brighter than another?
Now let's put this to work on the images.
You'll measure the signal from some of the standard stars on the map above. We have selected a region of the image of M3 taken in a 300 second exposure through the "V" filter. You will need to measure the images quantitatively, and we have ImageJ set up to make this easy for you. Use the following link to start ImageJ with two images of M3. One of the images is the center of the cluster, and the other is the north west (upper right) part of the map.
Click Here >> Start JS9 with images of M3
Or, if you already have astronomical display software such as "DS9", "ImageJ", or "Aladin" on your computer, you may download the images and run them locally if you prefer. We recommend trying JS9 first since will be easiest for you to use.
Click Here >> Download images of M3 to run locally
Remember to right click and "Save file as" if you want to save an image for local use. Fits images work with Imagej, Aladin, and ds9. The tif images work with Imagej, and photographic image programs like Photoshop and Gimp.
Inspect the image labelled "crop2", which from the upper right of the wide field shown in color above. This 300 second long exposure recorded stars fainter than 18th magnitude. The bright star in the image is star #206, at magnitude 9.86. Put the ImageJ cursor over the star and you can read (in the ImageJ window below the icons) the location of the cursor and the signal at that pixel. Move it around and you'll see it changes a little, so find the largest value representative of the star. For a more accurate measurement we would draw a circle around the star and sum all the pixels inside the circle, but just taking the largest value will work for now.
You have to watch out for the brightness of the sky too. If you put the cursor where there are no stars, there's still a signal there! It's a combination of light from the city scattered off the atmosphere, and "airglow" emitted by the upper atmosphere. You will have to measure and subtract this background from every star you measure. Let's start with that.
2. (Part one.) What is the background or "dark" signal?
Now look at star 216. It's not the brightest star in the image, since that star numbered 206 is too bright for us to measure accurately. Star 216 is more typical of the stars we are interested in, and is a good one to test our calibration.
To measure stars accurately you need to put the cursor on the brightest part of the image, and it helps to magnify the image to do this. Use "Image -> Zoom" in the menu, or center the cursor over the star and press "+" to magnify and "-" to demagnify as needed.
2. (Part two.) What is the signal from star 216? Be sure to subtract the background to get a measurement only for the star.
Now measure star 193, the slightly fainter one one just west of 216.
3. What is the signal from star 193? Again, remember to subtract the background. You can use the same background for all the stars you measure.
Now take the ratio of the two numbers you just found. Divide the signal for 216 by the smaller signal for 193.
4. What is the ratio of these two numbers? That's how much fainter 193 is than 216.
5. The last step is to find the magnitude difference. Take the log of the ratio you gave in answer to Question 4, and multiply by 5/2 = 2.5. How many magnitudes fainter is 193 than 216?
So you should see now how this works -- take the ratio of the signal of a star you want to know compared to one you already know, and find 2.5 times the log of the ratio to get the difference in magnitudes. But wait, we already know that from the calibration above. Look at the table and you'll see a magnitude given for both stars.
6. How does your measurement of the difference compare to the difference in the magnitudes in the table? If it's far off, you should go back and check your work. Use this to refine your technique until you are confident you can make an accurate measurement for other stars.
Let's do one more, a lot harder than these. There's a star labelled "b" on the figure. It is so faint that you cannot see it easily on the image in ImageJ. The star you do see is the brighter one just east (left) of this faint one, so to see the faint one change the brigtness of the display using "Image->Adjust->Brightness/Contrast" of the key combination "Ctrl+Shift+C". You can adjust it to make out the faint star. Measuring it accurately is difficult because the star is only a little brighter than the sky. Do the best you can.
7. What is the signal fo star "b" above the sky background. Compare this to 216, and calculate magnitude of star "b".
Now we are ready to look for something that you might not have expected.
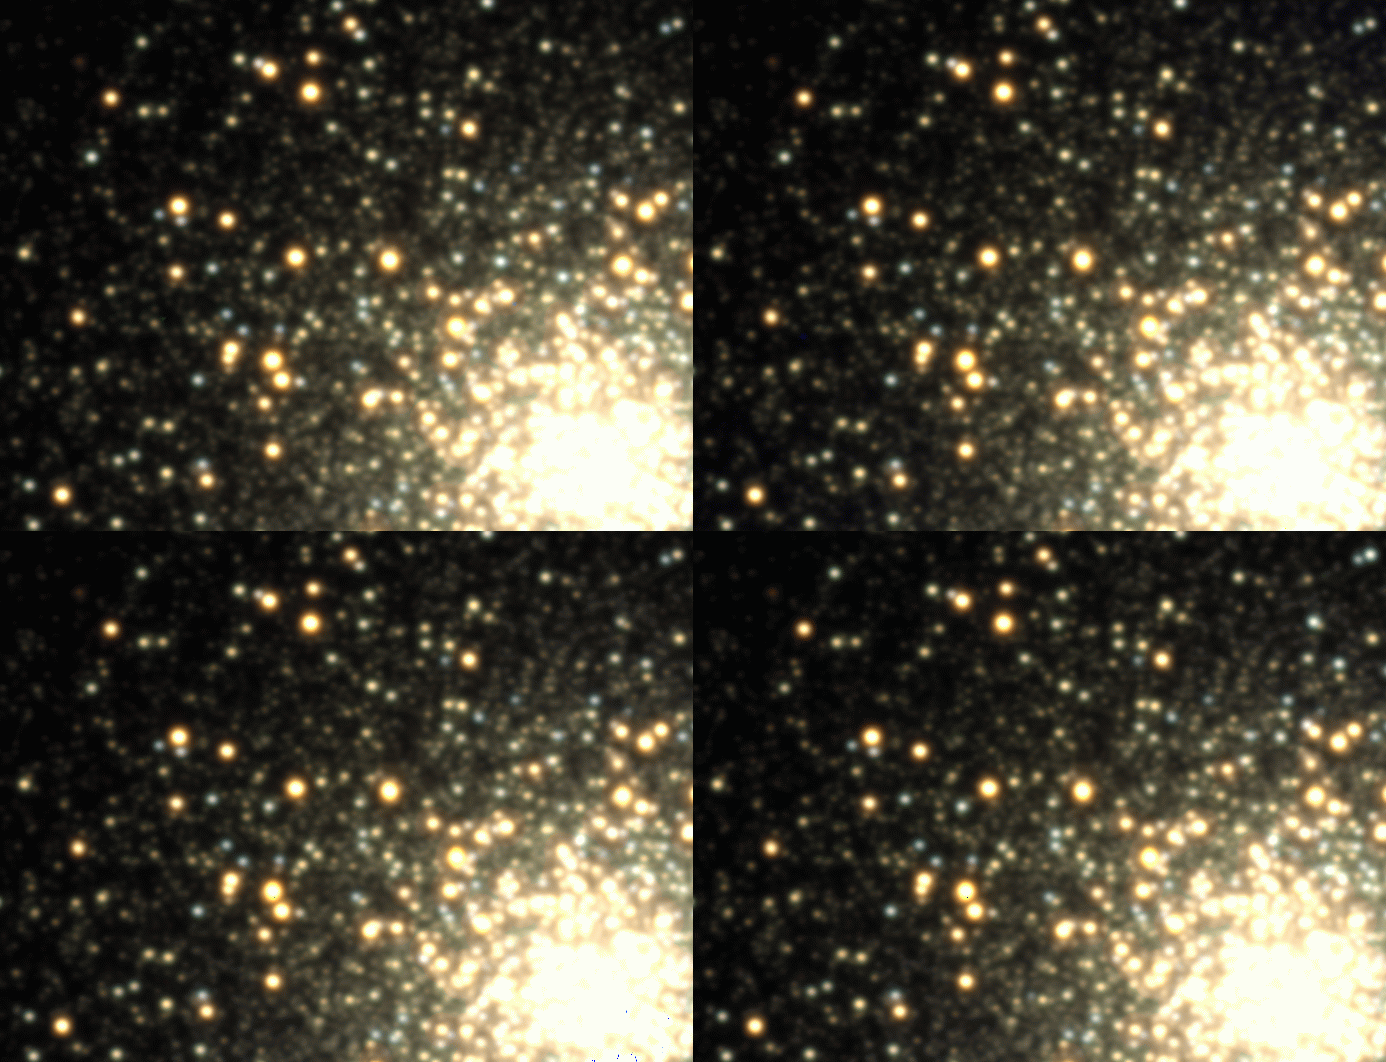
Color movie of the cluster M3 shows varying stars
Image courtesy of Joel D. Hartman, Princeton University.
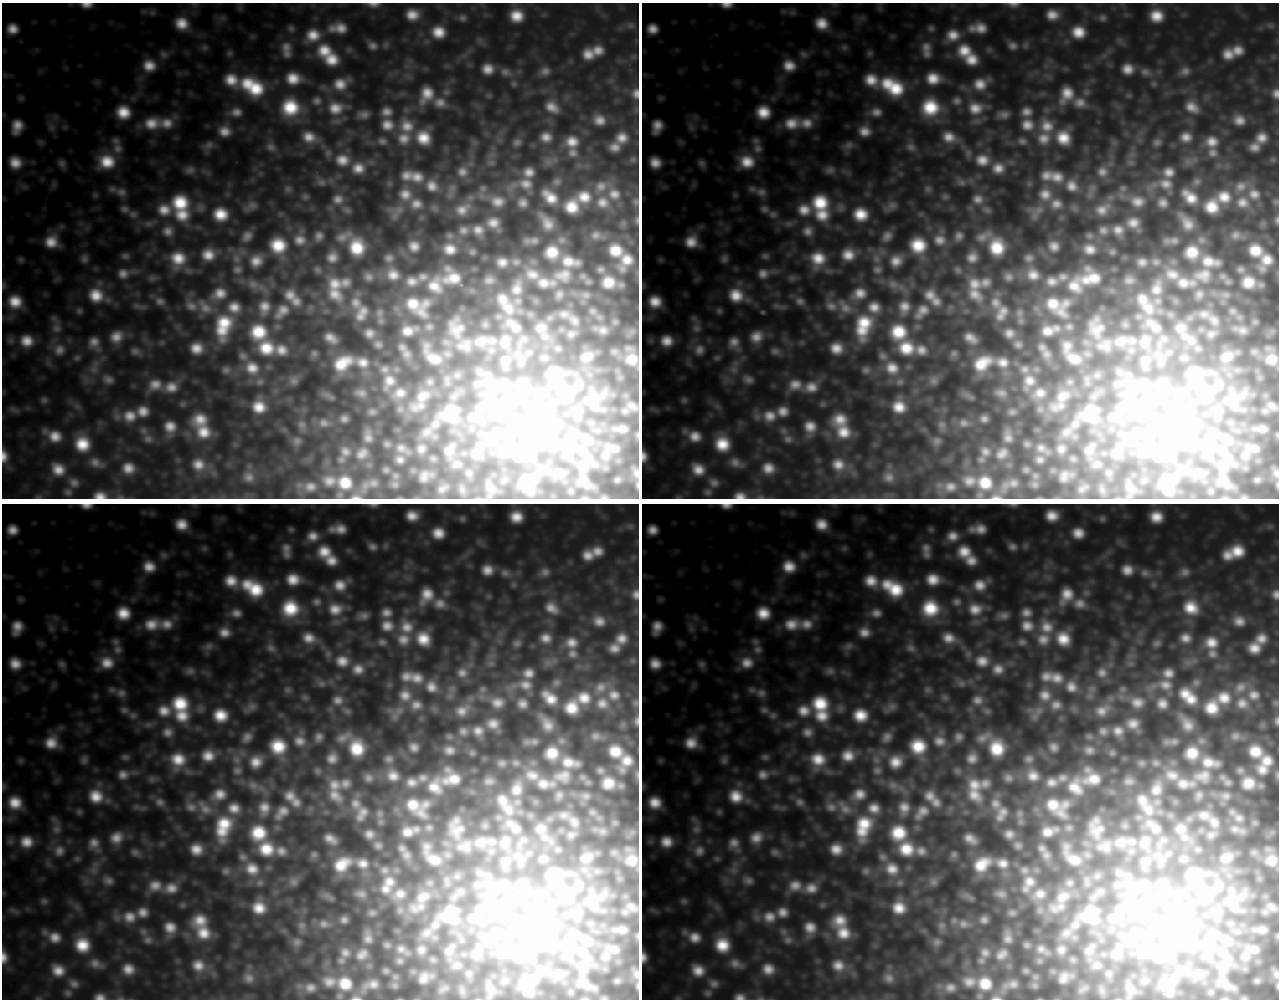
This is a sequence of 4 images taken on the same night, with each color image a superposition of individual frames taken through diffferent filters. Look carefully, and you'll see that some of the stars are changing brightness and color. This is the same region of M3 seen in the close up image you have in ImageJ. Another sequence, taken through a "B" or blue filter and shown below, reveals many more of these variable stars.
Variable stars in M3 in an image sequence courtesy of Joel D. Hartman, Princeton University. For more information, visit his website on M3.
Look at this image while you run ImageJ and inspect the image from the telescope. It takes a bit of work to find the patterns in the stars, but you can identify some of the variable stars on the ImageJ image of the center of the cluster. As with the fainter star in the calibration, you may have to adjust the brightness of the ImageJ display, but with so many variables you'll find some of them on your image. Measure at least 4 of them. Be sure to subtract the background you used for the calibration. Close to the center of the cluster it is also difficult not to have overlapping images, so look for examples where that does not seem to interfere.
8. What is the average signal from 4 or more variable stars in the M3?
9. Use your calibration signal for star 216 above, and calculate the magnitude of a typical variable star in M3.
Most of these varying stars are a type of pulsating star known by the name of their prototype, RR Lyrae. They share a remarkable property that they are nearly all the same absolute magnitude. This is the magnitude a star would have if it were seen at a distance of 10 parsecs, 32 light years. To learn more about RR Lyrae stars you can read the Wikipedia page, or follow up in your astronomy class textbook. They are very important stars in astronomy because this property of consistent absolute magnitude enables a measurement of the distance to one, whenever we can identify it as an RR Lyrae star. We can be sure of the type by carefully measuring the variation in brightness and color, as well as the spectrum of the star. Let's just assume that the average you have measured is representative of RR Lyrae stars in the cluster M3.
The average absolute magnitude of an RR Lyrae star is MV=+0.60. The apparent magnitude depends on distance:
mV = MV + 5 log D - 5
For example, if the star were 100 parsecs away (D=100), then log D would be 2, and the apparent magnitude would be 5x2 - 5 = 5 magnitudes fainter than its absolute magnitude. You have just measured the apparent magnitude and we know the absolute magnitude from studies of nearby RR Lyrae stars. You can calculate the distance to the cluster!
This equation is equivalent to
5 log D = m - M + 5
or
D = 10(m-M+5)/5
For example if m-M is 5, then (5+5)/5 is 2, and 102 = 100 parsecs. Use your measurement of m-M for the RR Lyrae stars in M3, and find the distance to this globular cluster. (Hint: It is not nearby.)
10. What is the distance you found for M3?
