Spectra
Introduction to the Rainbow
You've seen it, of course, dozens of times. An arc of color through the mist of a distant shower surrounds a point opposite the Sun in the sky. The rainbow is just a spectrum, visible sunlight dispersed into its component colors by refraction in droplets of water. For the astronomer a spectrum conveys a wealth of information. Light from the Sun, other stars, nebulae and galaxies can be analyzed to determine their composition, and the temperature, density and speed of their component gases.
We won't be able to illustrate everything with this experiment, but we will show you spectra of several different elements and how the state of the source alters the way it interacts with light. Those taking the lab in the daytime will also view the spectrum of the Sun and identify some of its strongest features.
The Spectrometer
The instrument you will use is like many of those in astronomical observatories and research laboratories. Light enters through a slit and is directed toward a concave mirror that renders the beam parallel. From there it goes to a diffraction grating that sends different wavelengths into different directions. The diffracted light then goes to another mirror that forms an image of the spectrum. The optics are arranged so that you can see the magnified spectrum through an eyepiece. There may also a small diffraction grating for you to look at. Hold it close to your eye and look through it to observe how it disperses light by interference, allowing beams from different parts of its surface to add only if the color is right for a given direction. The process is the same one that makes colors appear in light reflected from a CD.
Please remember that these instruments are delicate even if theydoesn't look like it.
Respect the note on the spectrometer
about the range of
adjustment possible. If the knob seems difficult to turn, ask the
assistant to check it for you.
Inside the spectrometer the angle that the grating sits at is determined by the crank on the side. As you turn the knob you are really just rotating the grating. A calibrated dial allows you to measure the wavelength of the light at the center of the eyepiece. The dial reading is in units of nanometers, billionths (10-9) of a meter. Green light, for example, has a wavelength of about 540 nm. An alternative unit is called the Angstrom, just abbreviated Å . One Å is 1/10000000000 (10-10) meter. Light with a wavelength of 5400 Å , that is about 1/2 of 1/1000 of a millimeter, appears to be green. You are likely to see either unit in a textbook, but we'll use nm here since the spectrometer dial reads those units directly.
If you are in the night sections of this lab and it is still daylight outside, you may want to skip immediately to to observing the spectrum of the Sun to take advantage of the remaining sunlight.
Color and Wavelength
The fiberoptic illuminator should be located on the other side of the worktable from the spectrometer. The illuminator provides an incandescent source of light from a hot tungsten filament. The light should be directed at the spectrometer slit as it leaves the fiber optic cable. This cable is flexible, and may be gently turned to send the light in the proper direction. Check the dial on the spectrometer and set it to about 540 nm. Look through the eyepiece. You should see green light. The purpose of this part of the experiment is to determine the color you see for different wavelengths. Set the dial sequentially to 400, 420, 440, ... , 660, and 680 nm.
1. Look through the eyepiece and write the color you see at the X cross hair on the data sheet for this experiment.
2. While you're at it, find the shortest and longest wavelengths you can see, and estimate what wavelength looks brightest to you.
The color
differences between wavelengths can be very pronounced -- some people
can tell a difference between the shades of yellow
from two wavelengths less than 20 nm apart.
Yet other colors are much more difficult to distinguish. We will use
color
in the rest of this experiment just to help casual identification of
specific spectral lines.
The incandescent lamp emits a continuous spectrum, producing all colors in a smooth distribution. A lamp like this actually gives off the spectrum of a blackbody. The tungsten in the filament has a temperature of about 2500~K, and most of its energy is emitted in the infrared where you can't even see it. It is the eye's own insensitivity to red light that limits your ability to see such longer wavelengths. The lens of the eye absorbs wavelengths below 400 nm, but in some cases you may see shorter wavelengths if they are strong enough. However, the incandescent lamp is really a poor source of violet or ultraviolet light.
Emission Spectrum
An electrical current passing through a rarefied gas can cause it to emit light. The flowing electrons collide with the atoms of the gas and impart energy to them. This causes the gas atoms to go into unstable excited states, but after a few nanoseconds they decay again to lower energy states and emit light. The photons that are given off in these decays carry away precisely the energy lost by the atom. Since the wavelength of light is determined by the energies of its photons, a gas excited in this way emits only discrete wavelengths characteristic of the energy changes of its atoms.
Set up the helium lamp in front of the slit and turn it on.
The lamp should go on its long side so that it is centered in front of
the
slit. Be cautious with this lamp, and with the hydrogen one. The
voltage
on the terminals is high and potentially hazardous. ZAP!
Move the lamp only when it is turned off.
Wait a few moments for it to get bright and then look through the eyepiece and turn the crank on the spectrometer. What wavelengths do you find?
3. Make a sequential list in the data table noting the color and the wavelength of each line you see.
Repeat this again with the other sources:
4. Hydrogen
5. Sodium
If you see more than 5 lines in each case, just identify the most prominent ones. For some elements, iron for instance, the visible emission spectrum would show hundreds of lines. The ones you study here look simpler, but in fact there are many lines you cannot see, at wavelengths above or below those the eye is sensitive to.
Notice the regular pattern of lines for hydrogen. The Balmer series starts with the red line, and continues into the blue and ultraviolet. You cannot see all the lines in this series, which ends below 360 nm. This pattern provided one of the best clues to the structure of the hydrogen atom, and was a basis for the development of our theories of quanta and the wave nature of matter. The Balmer series is also prominent in the spectra of Type A stars and gaseous nebulae.
Observe the Spectrum of the Sun
If it is daylight outside you'll be able to see the spectrum of the Sun. If not, skip to the next section. We've arranged things so that with a mirror you can direct light from the sky into the slit. While this light has scattered on its path through the Earth's atmosphere to the spectrometer, in the visible spectrum the only noticeable effects are additional bands due to water vapor and molecular oxygen. Set the dial for 540 nm, and adjust the mirror so that the spectrum is as bright as you can get it. You'll notice first that the colors are continuous, much like the incandescent lamp and very much unlike the electrical discharges. But on closer inspection you'll see a multitude of fine dark lines. These are the Fraunhofer lines caused by the absorption of selected wavelengths as light passes through the outer gases of the Sun's photosphere. Turn the knob and scan through the spectrum from red to violet. Fraunhofer lines are everywhere. Look for lines of hydrogen and sodium that you found with the emission sources.
6. Which of these can you see in sunlight? Make note of this on the data sheet.
7. What is the widest dark line you can find? If the sky is bright enough, look for lines below 400 nm.
Solar Spectrum Data
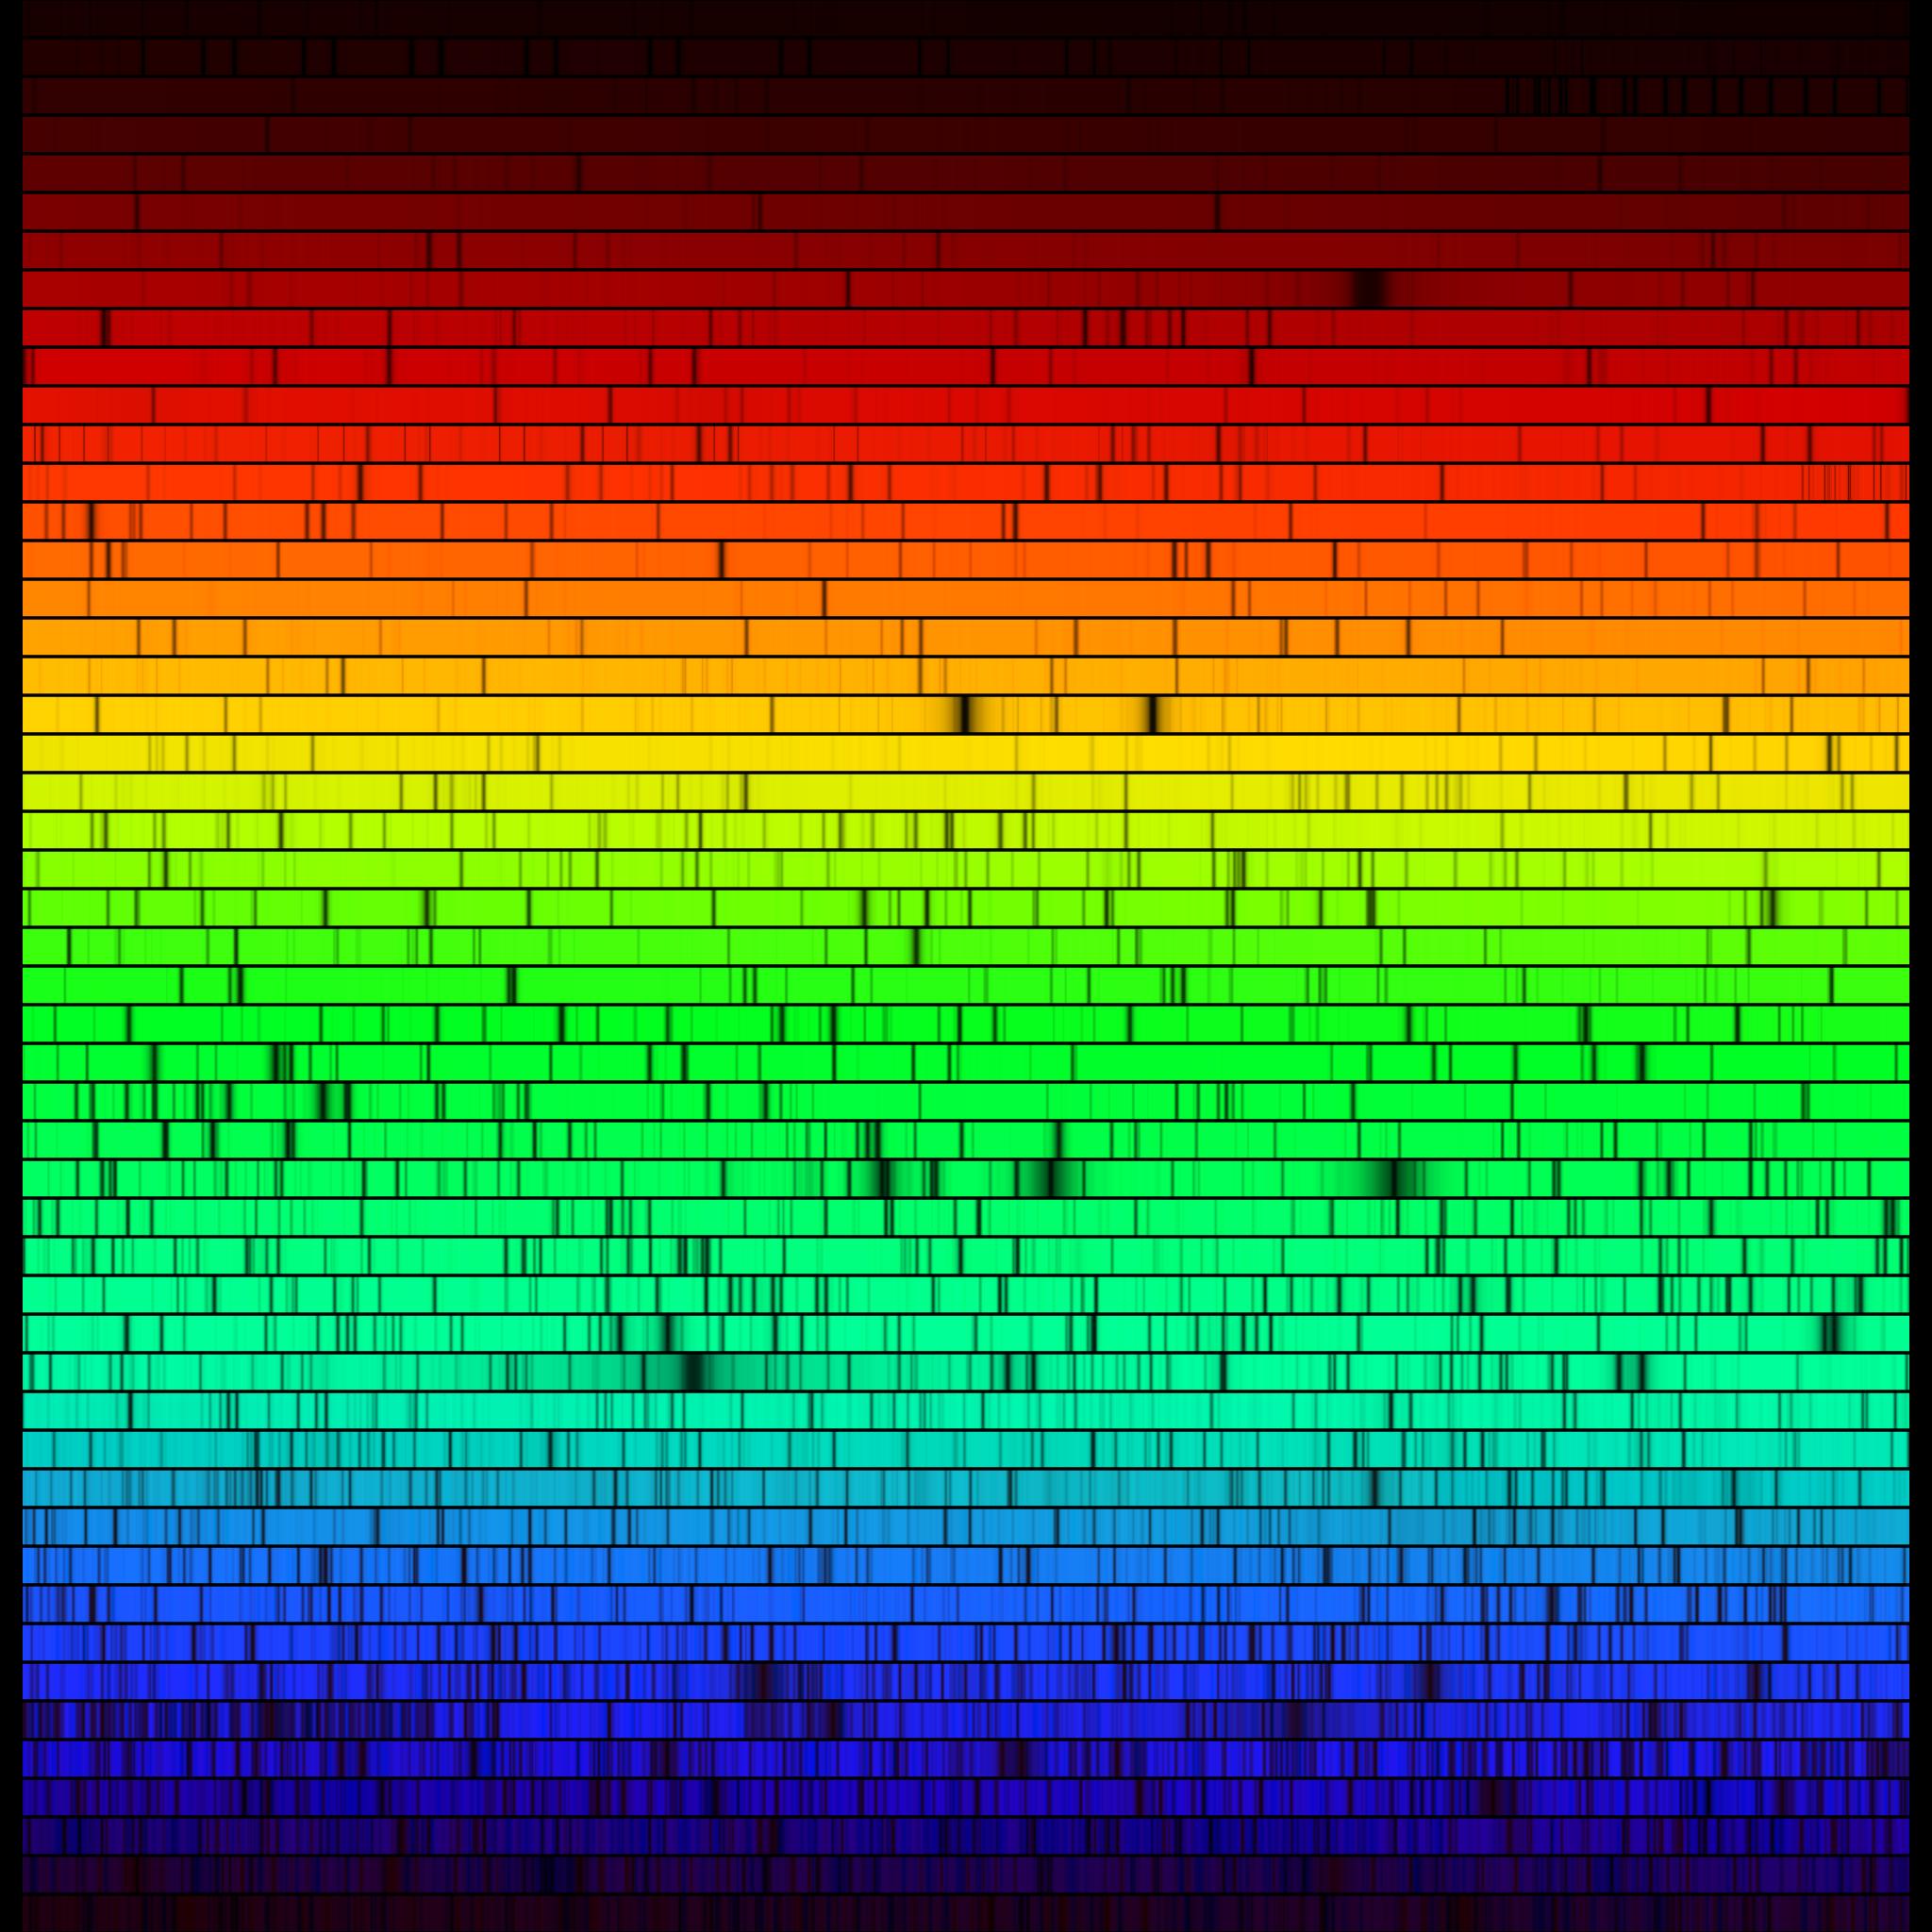
If you are in the night lab it may be too dark by the time you are ready to use the spectrometer. We have a color image of the solar spectrum available on the laboratory computers, and even if you saw the spectrum in the lab you should take a look at this image because it will be more detailed than the one you saw in the lab. To see the image, click on the icon for the solar spectrum that should appear on any of the lab screens.
The image is the same you see here:

While this image was generated from a measurement of the
solar spectrum that was made at the National Solar Observatory, the color
was added to reproduce the response of the eye to the different
wavelengths. It is an accurate representation of the spectrum you would see
if you were looking directly at sunlight.
Use the wavelength
scale and identify the strongest lines as if you were looking through
the spectrometer. If you have not done so already,
answer or add to your answers to the questions in the preceding section.
A local high resolution version you can view on your computer is on our server.
There are 50 strips, and each one is 6 nm or 60 Å wide. The spectrum runs from 400 nm at the blue to 700 nm at the red, 300 nm in all if the strips were placed end-to-end.
8. Based on the electronic version of the spectrum, which strips show the strong hydrogen line and the sodium lines you saw in the lab?
Observe Sodium Absorption Lines
You can also see absorption lines in the laboratory if the conditions are correct. Sodium, for instance, produces strong lines that are fairly easy to see. Pure sodium metal turns to vapor when it is warmed, and the vapor will absorb discrete wavelengths of visible light. To see this arrangement, turn on the sodium lamp that you used earlier and let it get warm enough to produce bright yellow emission spectral lines. Place the lamp on its side in front of the slit of the spectrometer. Yellow light should enter the spectrometer, and you should set the dial to see the lines in the eyepiece. Now turn on the illuminator too. Light from it will pass through the back hole in the lamp, through the lamp itself, and into the spectrometer. You should see the continuum from the illuminator and the yellow emission lines from the sodium lamp.

While you are looking at the yellow lines in the eyepiece, reach over and turn off the sodium lamp. Suddenly the yellow emission lines are gone, and in their place are dark absorption lines in the continuous spectrum of illuminator. The cool intervening sodium atoms are now removing the same wavelengths they previously emitted. Turn the sodium lamp back on and you'll see the yellow lines from the excited atoms again. If you have lab partners let them see this too while the sodium lamp is hot.
Now turn off the sodium lamp and wait. The dark lines stay as the lamp cools.
9. How many minutes do the sodium yellow lines remain visible in absorption after the lamp has been turned off?
10. Can you find any other dark absorption lines in the spectrum, or is it only this pair that show?