Observe Satellites of Jupiter and Saturn
You're familiar with the beautiful images from the Hubble Telescope and other astronomical observatories, but you may not know that these are a by-product of the data acquired for research. In this unit you will learn how we use astronomical images to make quantitative measurements.
Telescopes and Detectors
In their earliest use of telescopes, astronomers relied on their keen vision, memory, and trained assistants to "observe" the sky. With his "40-foot" telescope William Herschel spent thousands hours in the dark and cold peering down the tube from the platform at the top. He would read the sky like a sheet of music (he was a oboist by formal training) and compare what he saw with his recollections while his sister, Carolyn, took careful notes.
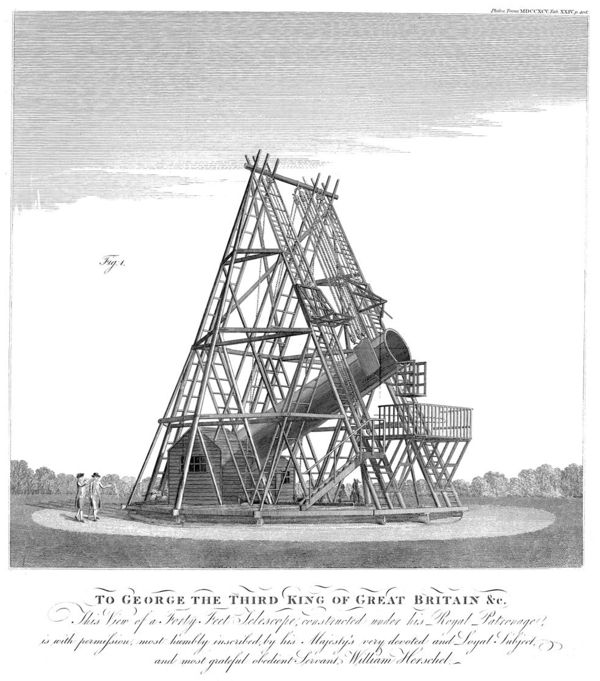
The principles have not changed since the first night of his observations in 1789, but the technology has advanced with electronics and computers taking over all these tasks.
In many ways, the modern earthbound telescope is like this one. The picture below is of a telescope far more powerful than Herschel's that we are installing in Australia for students in Kentucky to use remotely.
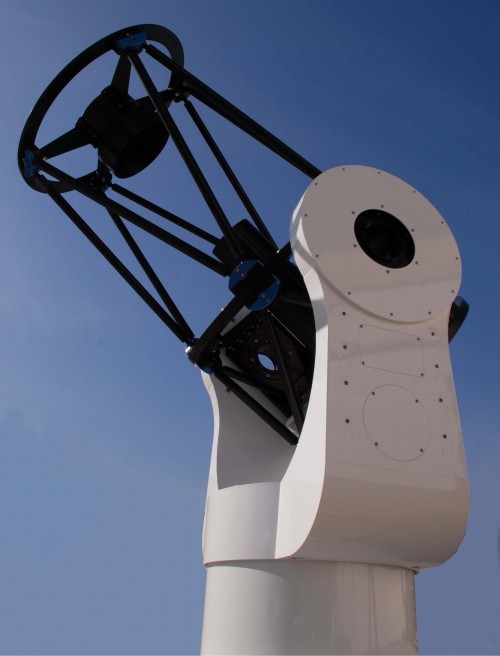
On our telescope computers run precision motors that keep it pointed at the target, while Herschel employed teams of workers to push his telescope around and pull it up and down. Where Herschel relied on his memory to find objects in the sky, the computers of a modern telescope have catalogs and very precise "encoders" tell the computers exactly where the telescope is looking. Atomic clocks keep time and allow the telescope to know the orientation of the Earth in space, and where objects in orbit around the Sun will appear to be from our moving point of view. We can still look through the modern telescope to see with our own eyes the images of distant planets and stars, but we rarely do. Instead, precision "scientific" cameras sense the light and form digital records of the images.
The astronomer's camera for visible light is similar in many ways to your own digital camera. There is a "sensor", usually a charge coupled device or CCD, electronics to measure the signal that it produces, and a computer to store that information in a usable form. The heart of the camera is a small piece of silicon that has been fabricated to isolate millions of pixels on a large flat surface. At each of these sites, an arriving photon is absorbed and its energy displaces an electron which is temporarily trapped at the pixel while it is being exposed to light. At the end of the exposure these electrons are moved off the device, one pixel at a time, and the total number of electrons is measured for each pixel. The computer stores these measurements in an array that becomes the image you ultimately see.
A digital camera with a 1 megapixel CCD might have 1024x1024 distinct sensing elements in a square array. If each one were 0.025 mm across, then the array would be 25.6x25.6 mm, just a little over 1 inch in size. In order to make a small digital camera like you would have in a cell phone, the pixels must be very tiny, and as a consequence they cannot hold much charge. Astronomical cameras usually have large pixels that are matched to the size of the images formed by the optics. The cameras in our telescopes are 50 mm on the diagonal, and ones in the large survey telescopes can be much bigger. Here's what our 4096x4096 sensor with pixels 0.009 mm across looks like.
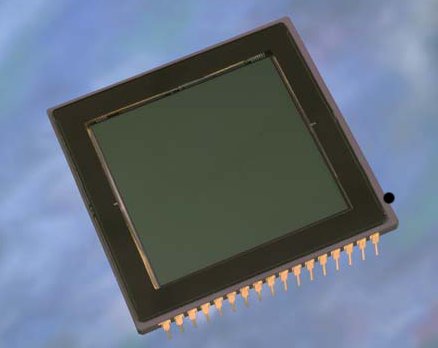
The scientific CCD used by astronomers is bigger and more sensitive than the one in your camera, and it is used for much longer exposures. While you want a fast exposure to capture the action with your cell phone, the astronomer prefers a long exposure to add as many photons as possible to its catch. Typical astronomical exposures are many seconds, and sometimes hours, long. During this time the cameras are cooled so that electrons will not move around due to the heat. Astronomical cameras for visible light operate at temperatures from -20 C to -100 C , and those used for the infrared must be even colder.
Light and Angle
Each stored image is an array of numbers, each proportional to the count of photons that were absorbed at a pixel during the exposure. The longer the exposure, the more photons, and the better the measurement of the light. To convert this array into an image, a computer reads the number at each pixel and turns up the brightness of the computer screen in proportion to the number. Here's an example for the image of a star.
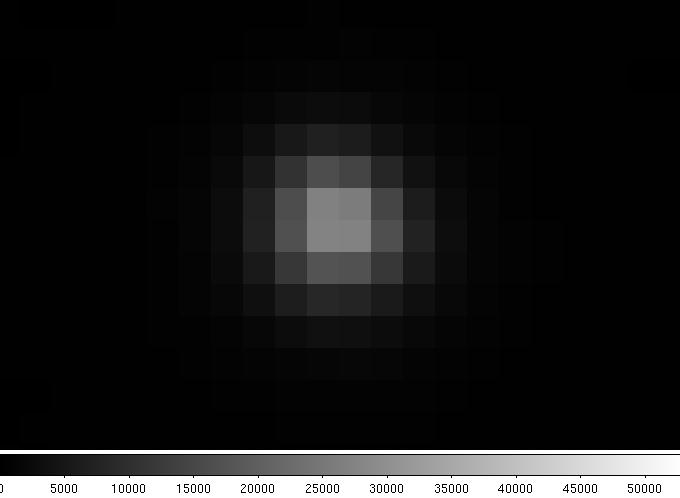
This magnified image of a single star was taken with one of our telescopes. The brightness of the display is greatest where the most photons were measured. You can see that the image is not perfectly sharp because of the blurring produced by the atmosphere. In this image a single pixel corresponded to 0.534 seconds of arc, and most of the light is within two pixels or about 1 second of arc. That is typical of a ground-based large telescope unless it actively corrects for atmospheric blurring or captures the rare perfect image when the air is exceptionally still.
The basic ideas are therefore that
- the signal at each pixel measures the light at that spot in the image
- the position of the pixel corresponds to a direction in the sky
The connection between light and the signal is simple enough:
The larger the telescope and the longer the exposure time the bigger the measured signal. The efficiency is a fraction accounting for the loss of photons going through the Earth's atmosphere, in the telescope, in selection by filters, and when photons are convereted to electrons in the detector. Even if we do not know these factors, we can compare the signals for different stars in the same image easily, as long as the detector responds to light in a predictable way.
The connection between position in the image and angle in the sky depends on the optical system. In the simplest arrangement it might look like this:
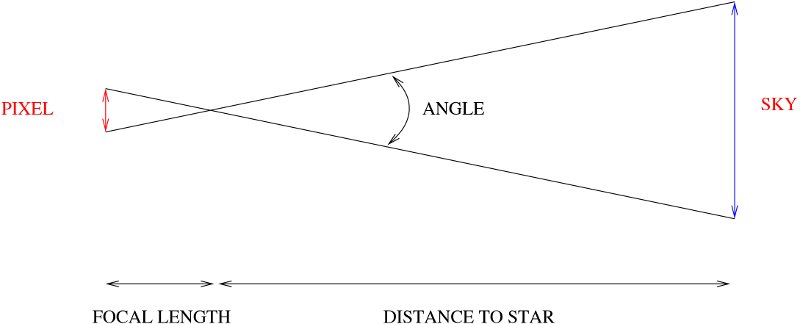
To see small angles on the sky we need long focal lengths and small pixels. The scale in seconds of arc per pixel depends on the combination of telescope and camera.
Let's see now how these ideas translate into practice with a program that displays and processes astronomical images.
Measuring Images of Jupiter's Satellites
The following describes how to start and use an image processing program called js9 on our server to view images of Jupiter and its satellites.
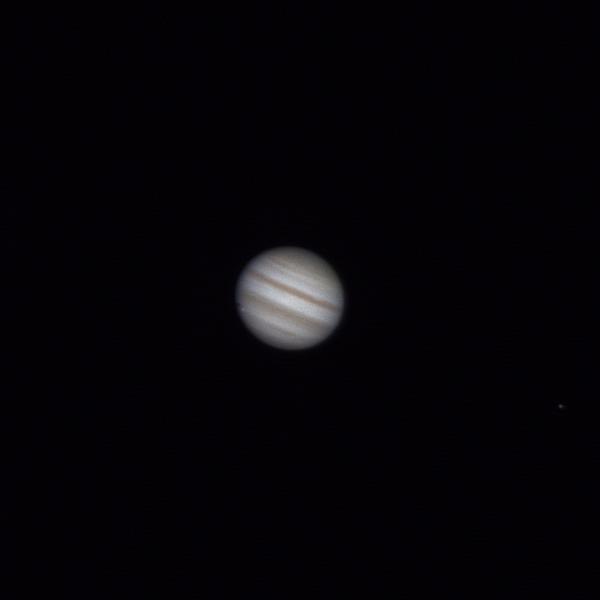
They were all taken in Octrober 2010 with a 12.5-inch telescope at Moore Observatory during an opposition of Jupiter. Click this link (try a right click and "Open in a new window")
http://www.astro.louisville.edu/js9_examples/js9_jupiter.html
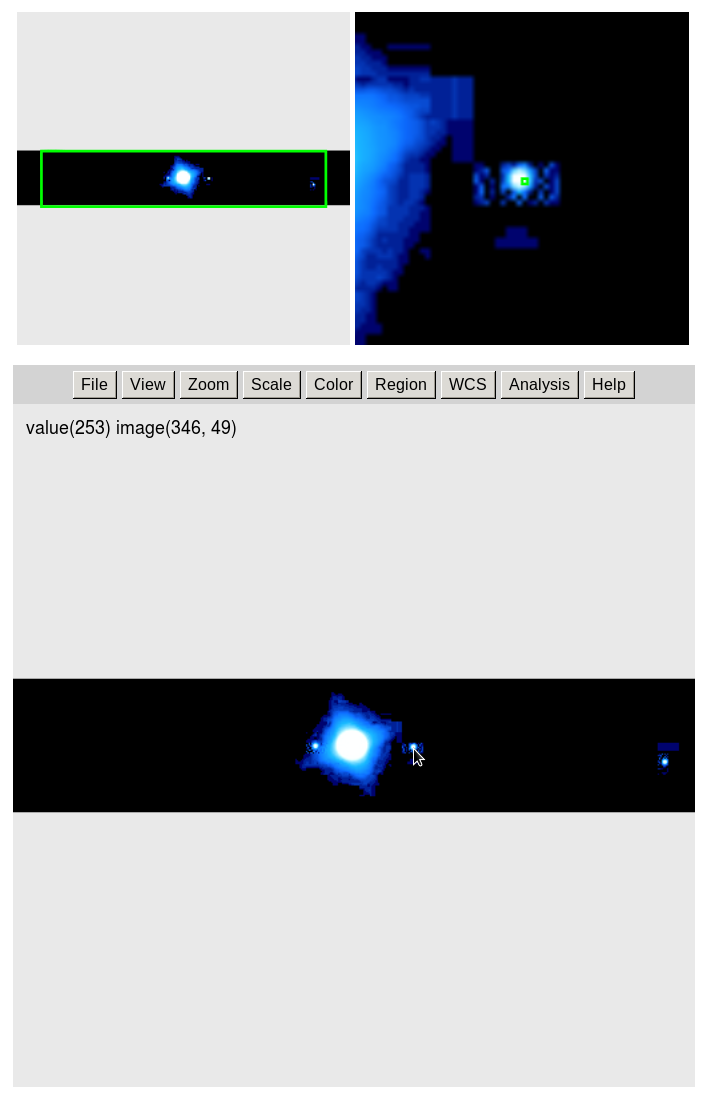
The js9 page will look like this. Once the page has loaded, follow the instructions on the page to measure each image.
When you move the cursor over the image the x and y coordinates will update and the value at those coordinates will change. The "value" is the amount of light measured in red, green and blue filters. It will go up to a maximum of 255, and down to 0 for these images.
The images you are using have been processed from the originals to orient the plane of Jupiter's equator left-right, and to make the file size manageable by reducing the range of values stored. The original images were taken with a Nikon D200 color camera and were 4256x2832 pixels, so they showed a much larger field of view and covered image intensities from 1 to 65,000 on a a scale of 0.493 arcseconds/pixel. The images you will use are reduced 4x, and the scale is 4x0.493=1.973 arcseconds per pixel.
- The image scale is 1.973 arcseconds (1/3600th of a degree) per pixel.
- The 600 pixel wide by 100 pixel high field of view is 1184 arcseconds wide by 197 arcseconds high
There are 13 images in the display, and you change the image by moving the bar at the bottom. 1/13 is the first one, 2/13 is the second, and so on. As you move the bar you will see the image name change too. It is always something like "jupiter_1286335254". The odd number is a time stamp that recorded how many seconds after a reference time it was when the image was taken. It doesn't matter what the reference time was though if you are interested you can read more about "unix time" here. You can convert this number to a date and time you are used to with this on-line tool:
If you try it for this one, you'll see that the image was taken on Wednesday, October 6, 2010 03:20:54 UTC (or GMT).
As you scroll through the images notice how the satellites move. Some of the images are taken on the same night and show small motions, while most of them are on successive nights and show much larger motions. Image number 1286427002, taken on Thursday, 07 October 7, 2010, at 04:50:02 UTC, is shown enlarged below with the satellites identified:

Your task is to measure the position of the satellites on the images with respect to the center of Jupiter. You should record your measurements on paper because you will later enter them into a spreadsheet to calculate properties of the satellite orbits and to find Jupiter's mass. All of the images have Jupiter centered, and you only need to measure "x" for each of the satellites you see, and to record that along with the Unix time stamp number. Most of the images have all four satellites, but some may only show 2 or 3 because satellites move across the face of Jupiter (like Callisto in the image above), or go behind Jupiter and are hidden from view. At first you won't know which one is which, but on the nights when there were several images one after another you can still follow the motion of individual satellites.
Make those measurements now (13 images, 4 "x" for each one, or 42 measurements all together except for those images that have fewer than 4 satellites. On one of the images carefully measure the "x" for your best estimate of the center of Jupiter. Whenever you cannot see a satellite, assign it to the center of Jupiter since either in front of or behind the disk. After you have done all that, come back here and these questions will guide you through an analysis.
There's one more hint, however. As you go through this the first time, watch for the brightest satellite. That one is Ganymede. Also the satellite that moves the fastest has the smallest orbit, and that one is Io. It's also red in color, but these exposures are so long that the color is lost in saturation of the image. Satellites are labeled with Roman numerals:
- I = Io
- II = Europa
- III = Ganymede
- IV = Callisto
in order of the diameter of their orbits and their maximum separation from Jupiter. You will need to figure out which one is which on the images, to find how big their orbits are, and how long it takes for them to complete an orbit. That's going to be difficult to sort out because it would take many months of observation to pick out the patterns without doubt, or some good luck at a few weeks of clear nights without a break so you could follow them exactly night by night. We'll help you out with the identification by pointing you to a web site that has an ephemeris of the satellites and map:
If you are having trouble figuring out which one is which, run the time conversion, find the corresponding date, and the use this applet to see how Jupiter looked on that night with the satellites identified. Sometimes it is simplest to identify the one that is brightest since that is Ganymede, and to know the Io if it is visible must be close to Jupiter.
Let's start by looking at the image example given above with timestamp 1286427002. Select it by moving slider at the bottom of the ImageJ image window. Then move the cursor over the image.
1. Which satellite is brightest in this image?
2. Which satellite is closest to Jupiter in this image?
3. How many pixels separate the image of Europa from the center of Jupiter?
4. How many seconds of arc (arcseconds or ") does this correspond to? (Hint: multiply the pixels by the scale in "/pix)
If you can answer these questions confidently, then you are on your way to understanding how to use images to find quantitative information. The next step is to follow the satellites as time goes by. It's easy on the same night, but quite tricky from one night to the next. That's where the Sky and Telescope applet comes in handy. Sort your measurements out in columns, ordered I, II, III, and IV for the four bright "Galilean" satellites. On one row put the positions of the four satellites and the time stamp, then on the next row do the next one, and so on. If you're used to using a spreadsheet, then you can take the template that is available here and simply fill in the values. If not, you can still do this by hand but it takes more time.
The spreadsheet already has the times entered, and space for x for each image. A few of them have been entered for you to help you get started. As you fill in the values the graph will update and you can see the pattern of satellite movements develop. When you are done, it should look something like this:
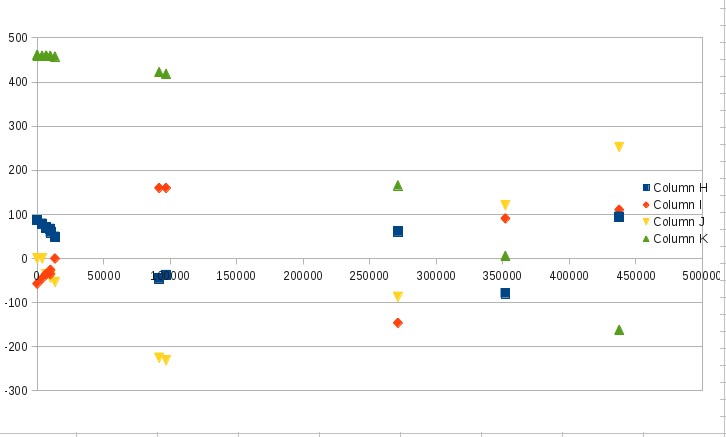
If the pattern you see after filling in your values has different colors, then you've misidentified a satellite. It should be easy to finish this part now, but be sure to enter data in the spreasheet only in columns B, C, D, and E for the satellites I, II, III, and IV; and use rows 3 through 15 for the 13 images. The other areas are calculated automatically. The spreadsheet will compute the angle from the center of Jupiter to the satellite just as you did in the example above.
Now we'll use this to find out something about Jupiter. Let's look at only Europa (II) and Callisto (IV) because the pattern for them is easiest to follow. You can see from the graph above that Io (the blue squares) is moving very fast, while the two we will measure are slower and well sampled in these images.
5. Just from the data that you have here, what was the maximum angle in arcseconds of Callisto from Jupiter?
6. How many seconds elapsed between the image when Callisto was most distant from Jupiter to the date when it was hidden from view?
7. What was the maximum angle in arcseconds of Europa?
8. How many seconds elapsed from the time it was first hidden behind Jupiter to when it was at its maximum angle from Jupiter?
Those times are 1/4 of the time it takes for the satellite to complete an orbit. You will need these later, so to make it easy and before you forget, just take the time in seconds, then multiply by 4 to get the time for a full orbit. Divide that by 86,400, the number of seconds in a day to have the period in days. You can check your own work since the period of Callisto's orbit is known to be 16.7 days. You should get close from your measurement, so if you are way off go back through the analysis and check, or ask for help in the forum.
You can see that the satellites appear to move back and forth because they are orbiting around Jupiter and we see their orbits nearly edge-on. It turns out that the orbits are nearly circular, something you could prove by measuring very precisely and watching the orbit from different directions as Jupiter itself orbits the Sun. Since they are circular, the semi-major axis of the ellipse that defines the orbit is just the radius of the circle. Let's say that radius is "S", for how far the satellite is from Jupiter, and that we see it when Jupiter is a distance D away. You may already be familiar with how to calculate the small angle from distance if you know a little geometry or trigonometry, but it also easy to see this from proportions. A full circle has 360 degrees, and a circumference of 2π times its radius. Think of a circle with you at the center and Jupiter on the circle. The radius of the circle is D, the distance of Jupiter, and its circumference is 2πD. All the away around this circle is 360 degrees, but we only want the fraction that is the angle covered by the separation of the satellite from Jupiter. That fraction of a full circle is
so we simply multiply it by 360 degrees to find the angle:
in degrees, or in arcseconds
Let's turn this around and ask if we know A, what is the distance S? That's a little algebra:
This works as long as we measure A in arcseconds, with S and D in the same units. If, for example, A is 100 arcseconds and D is 5 astronomical units, the S is 50/206265 astronomical units (1 AU is about 150,000,000 km).
Jupiter is about 5 AU from the Sun and Earth is 1 AU. At opposition, Jupiter and Earth are 4 AU apart, and at conjunction they are 6 AU apart. For these data they were roughly half way between and it was about 5 AU from Jupiter to Earth. Use that, and calculate for Europa and for Callisto the semimajor axis of their orbits. Just multiple the angle you measured by 5 AU and divide by 206265 and you have it, in AU.
9. Based on your measurements (not on something you look up), what are the distances of Europa nd Callisto from Jupiter in astronomical units? You can convert these distances to kilometers by multiplying by 150,000,000, but AU are the usual units for surveying the solar system.
If you need an online calculator here's one you can try:
You know enough about the motions of the satellites to use them and Kepler's Third Law to find the mass of Jupiter. If you are taking the elementary astronomy course you may already know that Kepler's Third Law describes the motions of the planets around the Sun, satellites around planets, or even stars around one another. It was discovered by observation, but may be proven from Newton's Law of Gravity and the Laws of Motion. It says that
P2 = A3/M
when P is the period of the orbit in Earth years, A is the "radius" or semi-major axis of the orbit in astronomical units, and M is the mass of the system in solar masses. It works for Earth! In that case P=1, A=1, and M=1. To use it for Jupiter's satellites we just need to take the A we found for their orbits, with P in years. Let's find the mass of Jupiter now. With a little algebra
M = A3/P2
For example, if for Ganymede you had A = 0.0071 astronomical units, and P = 7.2 days or 7.2/365 = 0.0197 years, then the mass of Jupiter would have to be
M = 0.00713/0.01972
M = 0.0009 solar masses
You will have different numbers for both Europa and Callisto, but if you have everything about right they should give you the same mass.
10. Approximately, what did you find for the mass of Jupiter in units of the Sun's mass?
