Use a CCD Camera
The Charged Coupled Device (or CCD) camera is a powerful tool for astronomers to acquire images with ultraviolet, visible, and infrared light. All the the images from the Hubble Space Telescope, for example, were taken with cameras based on this technology. Today, similar sensors are in your cell phone and laptop web cameras, but at the time they first appeared for scientific use in the 1980's they revolutionized optical astronomy. In this experiment you will use one that is on line in our elementary astronomy teaching laboratory. It is a smaller version of a camera that we use on our remotely operated telescopes. First, let's take a few minutes to describe what a CCD is, and how the images it takes make precision data available to astronomers. You may have already done an experiment that used such data, but now you'll take new images of your own.
The CCD
The CCD sensor is a piece of silicon (glass is mostly silicon dioxide, but this is nearly pure silicon) that has been processed to have an array of independent light sensitive elements. The one in the camera you are using was made by Eastman Kodak Yes, the company formerly famous for film also made some of the best CCD's available. While their film business failed, their CCD engineering business flourished and was absorbed by On Semiconductor.
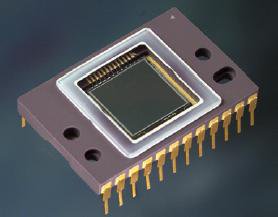
The light sensitive area is the square about 1 cm on a side. It is under a protective glass cover, and attaches to the electronics of the camera through the gold-plated pins. In our camera, the sensor is cooled to -10 C with an electrical "Peltier" refrigerator that is in contact with it from the back.
This device has 512x512 square pixels in that sensitive area -- each 20 millionths of a meter (20 microns) across. When a photon (a light particle) arrives near one of these, there is about a 50% chance that it will excite an electron that will be trapped in the pixel. After an exposure, we measure how many electrons are in each one, and that tells us how much light arrived at each pixel during the exposure. The name "charge coupled" comes from the technology that moves this charge across a row and then down an edge of the sensor to the amplifier that produces the signal we measure. The result is a number for each pixel that is proportional to how many photons arrived there during the exposure.
The sensor is not equally sensitive to all light. CCD's based on silicon are most sensitive to red light. Here's a graph that shows how this varies from the ultraviolet (below 400 nanometers (nm) to the infrared (above 700 nm).
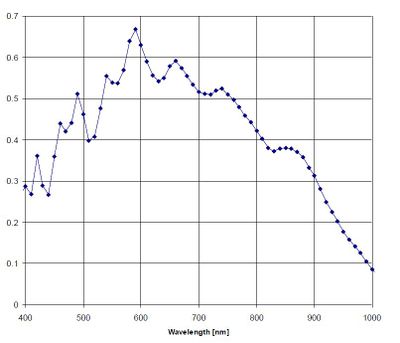
Although it is not uniform, we can measure this very accurately and calibrate the sensor so that we can compare the amount of light arriving in different colors.
Filters
If we can measure how much light comes from a star or planet for different wavelengths, we can determine its temperature, composition, and even it speed. Your eye senses different wavelengths as color. For example, here's a spectrum of the Sun.

The dark lines are from elements in the Sun's atmosphere that absorb specific wavelengths of light. Calcium, for example, has removed a some ultraviolet light at two wavelengths near 380 nm on the left, sodium has removed some in the yellow at 589 nm near the center, and hyrdogen made the dark line in the red at 656 nm on the right. The blackness toward the far right is infrared, to which our eyes are not sensitive but the CCD camera can measure.
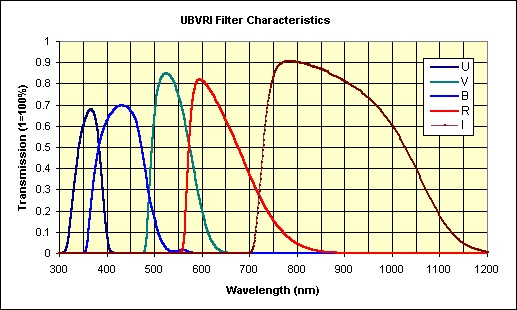
We use filters to isolate broad bands of different colors. In this experiment we have two sets of filters available that selectively transmit light in regions from the ultaviolet to the infrared.
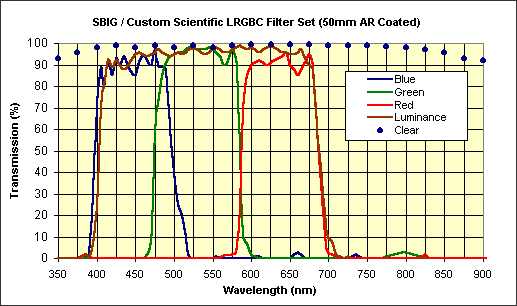
The upper set is labeled RGBCL for red, green, blue, clear and luminosity. These are usually used to make images in color similar to what you would see with your eyes. "Clear" means that it transmits almost all light, and "luminosity" means that it transmits almost all visible light but rejects the infrared.
The lower set is labeled UBVRI for ultraviolet, blue, visible, red, and infrared. These are the filters that astronomers use to measure the characteristics of stars in a system of standard bands. The choice of bands is largely historical, and goes back to the sensitivity of photographic materials when measurements of this type were first done. There are other systems in use now that are more efficient, and we use those with our telescopes. However for this experiment you will have a choice of any one of the 10 filters in these curves. Choose the R filter from the RGB set and you will get image that shows only red light, while the G filter shows only green, and the B filter only blue. You can put these back together and make a full color image, or compare them quantitatively to see how much redder one part of the image is than another. The UBVRI set extends this into the infrared and the ultraviolet, while the visible B, V, and R filters are somewhat different from those in the RGB set.
Now let's see how this actually works!
Using the Camera
To access the camera you must go to this website. If you click on this link it should open up another browser window so that you can see both this page of instructions and the camera control:
If you are successful, you may see something that looks like this:
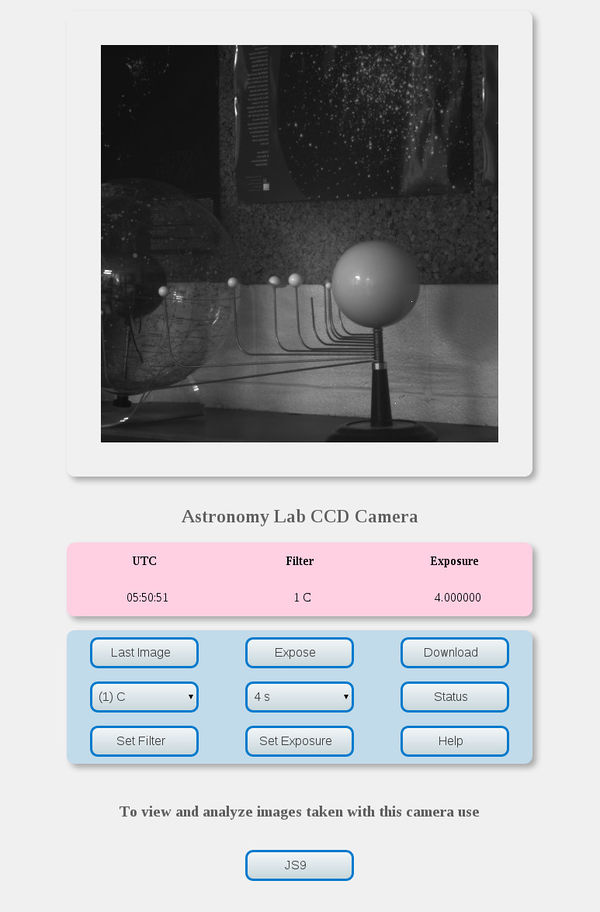
The image you see at first may be one taken earlier by another user. The buttons will control the camera, take an image, and allow you to copy the image to your own computer:
- Last Image -- displays the most recent image taken
- Expose -- takes an exposure with the current settings and displays the new image
- Download -- shows you a list of image available. To retrieve one, right click and "Save as ..."
- Set Filter -- sets the filter choice that is shown in the thumbwheel box to its left. Select the filter you want, then click "Set Filter" for this to take effect.
- Set Exposure -- sets the exposure time that is shown in the thumbwheel box to its left. Select the exposure you want, then click "Set Exposure" for this to take effect.
- Camera Status -- will display the coordinated universal time (the time on the prime meridian in Great Britain), the filter number, and the exposure time in seconds.
The camera should already be turned on and pointed at a globe of the Earth and a model of the solar system in our elementary astronomy teaching laboratory on Belknap Campus of the University of Louisville. If you are actually in this lab you can see the camera and its target but you will use the same web interface that students in the distance education section use.
You are going to take three images with three different filters and save those images to your own computer for analysis later.
Take at least three images in different filters. The camera has a choice of 10 filters and you can try all of them too if want to. You will need to change the exposure time for different filter choices. Pick an exposure time that is long enough to see something interesting, and not so long that everything is "saturated". That is, if the time is too long then the detector has so much charge it cannot make a measurement and the image is pure white. If it is too short, there are not enough photons for an accurate measurement and the image will look grainy, or even black. Start by using one exposure time for all the filters. Since you can return to this activity any time, if you are interested in seeing how exposures affect the data, come back and experiment with it after you have finished the required parts. The last image you take in each filter will be the one that is available for later analysis on line.
Pick three filters in order to get a color image at visible wavelengths ( either of the "B" blue filters), in the middle of the spectrum (the "G" green filter of the "V" filter), and the red (either of the "R" filters). Also take an image in the infrared (I) to see how different it is from visible light.
For later use you may also download images to your own computer and view them with programs such as ds9 used by astronomers, ImageJ used by the biologists and doctors, and Photoshop or Gimp used by artists. After you take each image click on "Download" and save the last "fits" file and the last "jpg" file. The file names have unique numbers that record the time the image was taken. The largest number is the most recent image. The file names also have the filter number, so something like
ccd_9_1395038377.jpg
is a "jpg" image taken with filter "9". The timestamp is in seconds, and decoded it would tell us the date and time as well.
You may find that your use and other students or visitors use will overlap so be aware that someone else may be taking pictures too. If you identify and download images as soon as you take them, then the chance of someone else also taking one while you are working is small. In the the next part you will work with images in "JS9", the on-line viewer for FITS images. As in some of our other activities, you could also use software on your own computer but running it on-line should be easier and faster.
Analyze your Images and Answer these Questions
The most recent images taken in all 10 filters are on line for display here:
If you are successful, you may see something that looks like this:
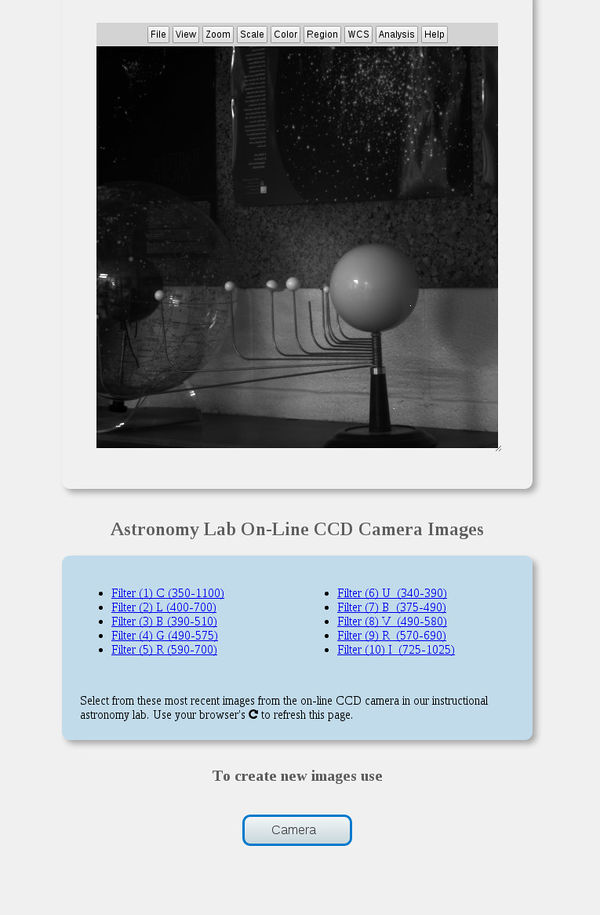
Click on one of the Filter selections at the bottom of the page. It should load and display that image for you. If you are doing this soon after taking your own images, the ones shown here will be the ones you took. However someone else may have done others, and you can view all 10 of the most recent ones. You may also start from the beginning at any time. The [Shift] key plus a click on the round arrow "reload" button of most browsers will erase its memory of the images, and let you load them again. If you decide to take more images with the camera then use this technique to get a fresh start on their display.
Once you have selected an image from the list at the top of the page it will be available to you later in the File menu on the display. Simply select it under File to have it appear. Pick three images that you want to show as Red, Green, and Blue. For each one
- Select File -> Open and view that image.
- Select Scale -> Lin to see it as a linear rather than a logarthmic display. You may adjust the low value and the high value to make the display show at its best.
- Select Color -> Red, Green or Blue for each of the images to match the color you think is best. For example, an "R" or red filter image should be red. However an infrared filter image might be best highlighted by making it Green. Make the choices that help you understand what the camera is seeing.
Notice that as you move the cursor over an image the JS9 control panel will tell you the pixel coordinates (x,y) and the amount of light at each pixel.
Look at the Sun in the model solar system. It will be the large globe at the center of the model.
1. What is the diameter of the Sun in pixels in one of these images? Simply move the cursor across the image and take the difference in x going from one side of the Sun to the other.
If this were something in the sky and you know the calibration of angle to pixel you could find the angular size of the object this way.
Put the cursor as best you can tell at the midpoint in x and y on the image of the Sun. All the images will have the same coordinates because they are all taken of the same thing with the camera fixed. Only the filter changed between exposures.
2. Where is the center of the Sun on these images? Give x and y for this pixel.
For each of the three images in sequence, note the value of the signal at pixel near the center of the Sun. This is a measure of how much light you have in the image at that point.
3. How much signal is there at the center of the Sun in the red image?
4. In the green image?
5. In the blue image?
These differences suggest that that model Sun is not white, but what color is it? The CCD responds differently to different wavelengths, and each filter has a different efficiency too. We might be able to sort this out if we knew something in the image was white.
Let's make a color image from these and see what that looks like. Here's how we did that before:
Look at each of your red, green and blue images, make sure they show respectively as red, green, and blue. Use the Color menu and select from the bottom of the menu the optional "rgbMode". Once you click on that you will see all three images together. This is called a "composite" RGB image, and it is how color is rendered in print and film. The color will probably not look right, because you have not weighted the amount of light in each color to appropriately represent how the CCD detector senses the light, and how your eye responds to the image on your monitor.
However, you can see that there are colors in the field of view, and you can see the color of the Sun!
6. Overall, what color seems to dominate this composite? Does it look too red, too green, too blue, or does it seem reasonably good?
Now you pick a part of the image data in each color and use it to set the screen's red, green, and blue display. The best way to see the effect is just to experiment with it. Select an image that you have assigned to a color and use the mouse to change its display. As you make it brighter, that color is more vibrant in the image. You can adjust them individually and try to balance the colors and find a composite that seems nearly natural. The Scale menu also allows you to enter numbers for the low and high values which may be useful for quantitative control too.
Minimum -- sets the lowest value in the image for that color that becomes black on the screen
Maximum -- sets the highest value in the image for that color that becomes as bright as possible, e.g. bright red, green or blue.
Try adjusting these for the red, green and blue images to make something you think represents the field that was recorded. It may help to look at things in the field that you think should be white.
7. What color is the Sun now?
Compare your image now with the measurements of individual colors you made earlier.
8. Which of the filters gave the strongest signal on the Sun? Explain how the Sun's apparent color compares to the signals in the different filters.
There are some other things you may notice now. The Earth globe, for example, shows oceans and land masses. If you have the color balance about right the oceans will be light blue. The planets in the solar system model have different colors too. One of them is white.
9. What is the diameter in pixels of the white planet?
If you want to save the color image you have made, use the File-> Print option of the display to save or print only the image and not the entire webpage.
Lastly, open the infrared image that you took. You can compare it to others, or even make a composite in which infrared becomes red on the screen, the red filter becomes, green, the green filter becomes blue ... use your imagination and see how colors can be used to distinguish things of interest.
10. What did you find in the field of view that is brighter in the infrared than it is in the visible?